There is not much, weather wise, to talk about for at least the next two weeks. So lets take a look back at one of the most memorable blizzards to strike the NYC Metro area.
December 27, 2010.
Here was the final snow map for the Boxing Day Blizzard:

This impressive storm dropped 10+ inches of snowfall from North Carolina all the way up into Maine. As you get into NJ, there are widespread 1-2 feet snow amounts and, locally, 30+ inches of snow in northeast NJ and parts of southern NY state.
Here is a close up of the northeast:

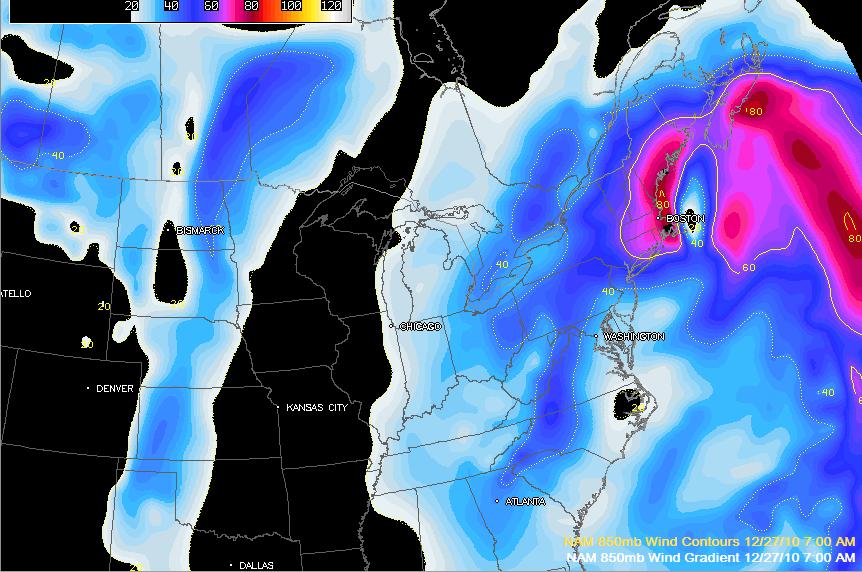
What was the most essential factor that put this storm together? The -NAO.

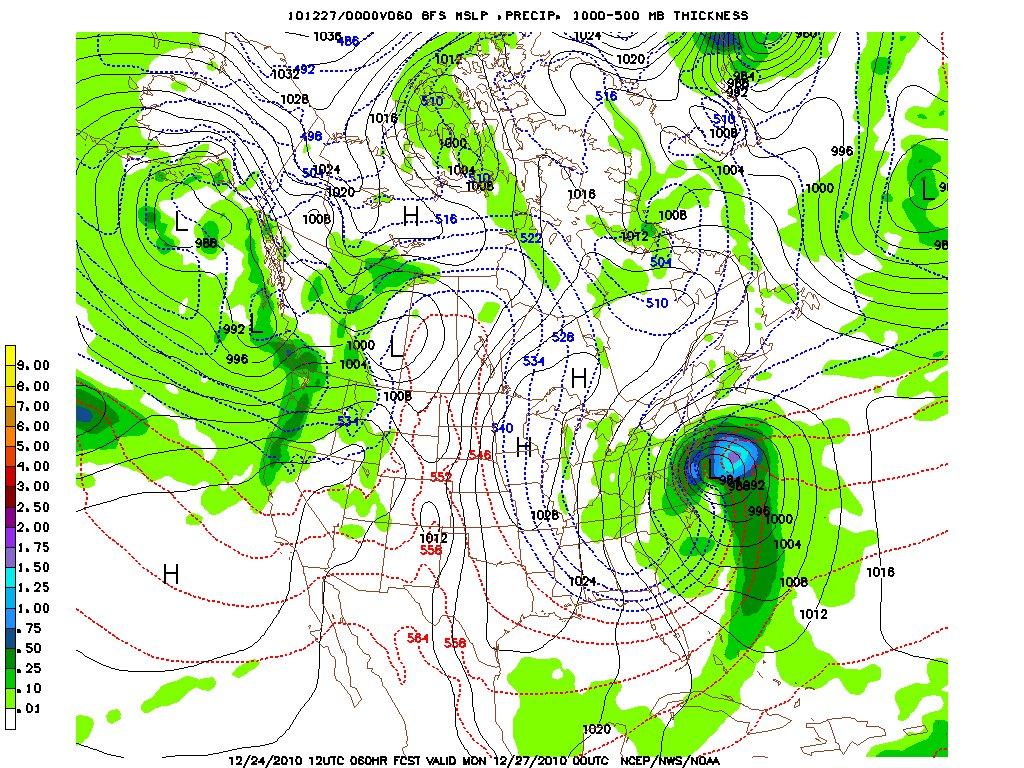
An NAO in a negative state brings positive heights into Greenland which allows the jet stream to dip and create a trough along the eastern U.S. This creates an arctic flow of air to filter into the eastern U.S. Now, compare the graphic above created by TWC with the 500mb map the day of 12/27/10...

You see that huge trough in the eastern U.S. with low heights extending all the way down into Florida? That is a very amplified pattern of a +PNA, -NAO, and -AO. This looks very much like the TWC graphic. The -NAO allows two bundles of energy to come together which ultimately develops a powerful Nor'easter, in this case known as the "Boxing Day Blizzard" or in my own terminology, a "Godzilla."
Here are a series of my favorite images or gifs of this historical snowstorm:


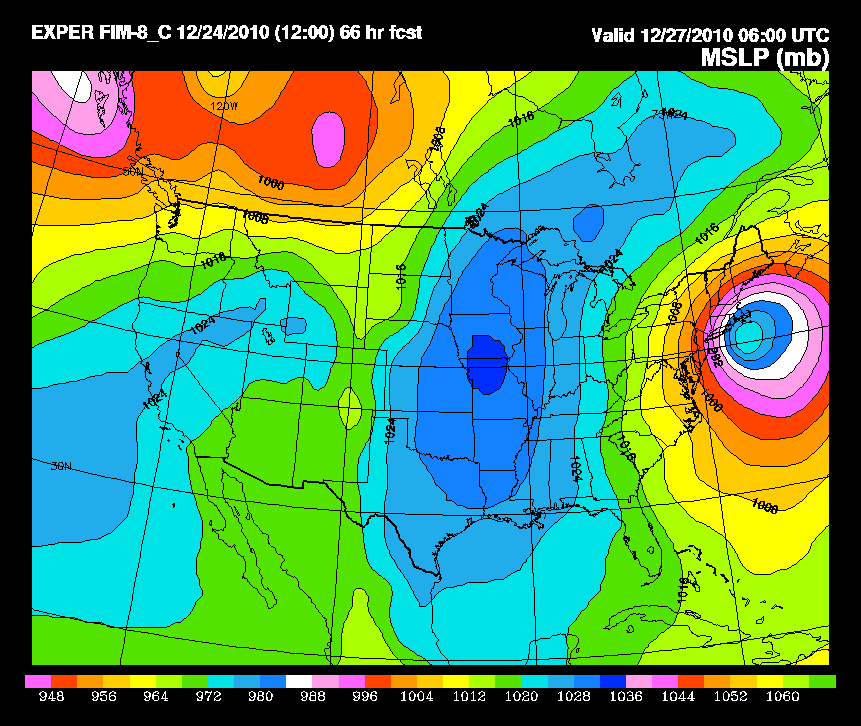
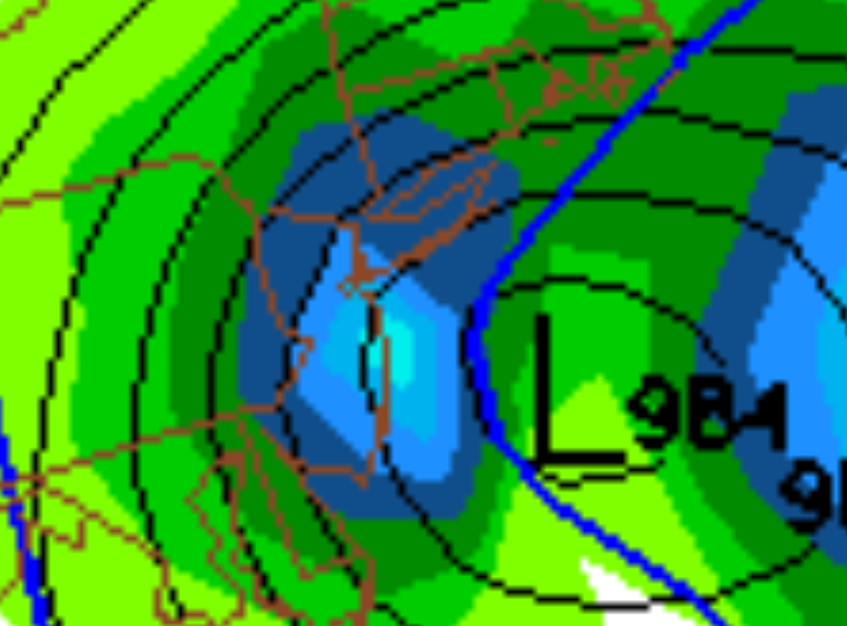
And here are some gifs...
http://cimss.ssec.wisc.edu/goes/blog/wp-content/uploads/2010/12/101226-27_g13_wv_anim.gif
http://www.erh.noaa.gov/okx/SOO/case_studies/12262010/sfcir.gif
http://synoptic.envsci.rutgers.edu/riggi/101226_27_kdix.gif
http://www.erh.noaa.gov/okx/SOO/case_studies/12262010/500mb.gif
Have a nice night,
-Frank
No comments:
Post a Comment