Happy New Year!
I wrote about our weather pattern going through a change after the New Year in my last blog post. I concluded that the period spanning December 30th to January 10th will be one to watch for our first snow of the season. What happens after JAN 10th remains unknown, but I do have new thoughts that I will share in the long range thread of the forum within the coming days. Low and behold, we have our first real storm threat of the season JAN 6th-7th. It is generating a lot of attention and the snow maps are trickling out daily! They are ranging anywhere from 0" to 8" for NYC.
Let's take a deeper look into this storm's evolution.

It is important to mention our air mass is not incredibly cold. Here is a map of the 850mb temps valid for Saturday morning. Above the yellow line is where the northern jet is located. Notice that is also where the true arctic air mass is found. In this particular set-up, the northern jet is not really a factor. The storm is originating from the south and getting its "juice" from the El Nino-fueled sub-tropical jet stream. The air mass is considered "antecedent;" meaning; it is residual air that has been around for several days, whereas our classic snowstorms get an injection of fresh arctic air due to the northern jet phasing in polar energy.

Let's now look at the 500mb level using today's 12z EURO valid Saturday afternoon. At this point, the surface low is already approaching the Mid-Atlantic and precip is about to get into southern NJ. To be honest, I am not a huge fan of the look of this when it comes to classical snowstorm set-ups. The upper air energy has a strung-out look to it. You have some PvA escaping east (right black circle) and some hanging back over Ohio (left black circle). In between you are left with weak forcing and the potential to dry slot. Further, you have an upper level low circulation over the Great Lakes that is trying to keep upper level winds out of the south-southwest direction. Lastly, all that PvA draped along the southeastern U.S. and back toward Texas, is unable to consolidate into the storm because of the -WPO/-PNA set-up further west.


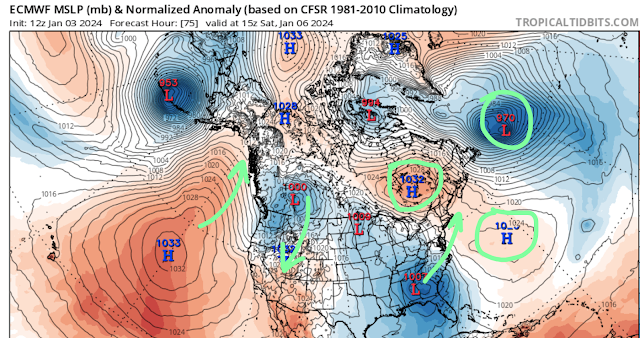
Here is the MSLP map according to today's 12z EURO valid for this Saturday morning. A few very important features to call out: the 50/50 low in the NW Atlantic, the High Pressure over SE Canada, and another High Pressure in the west-central Atlantic. The placement of these areas of High (or Low) pressures help dictate the eventual path of the storm, which from this map you can see is brewing in the southeastern U.S. Based on this, it will be improbable for this storm to cut west of NJ due to the pressing -EPO ridge and "blocking HP" in SE Canada. The 50/50 Low and -NAO is allowing the Canadian HP to hold position instead of trying to retreat north-northeast. This keeps our cold air in place. However, the other HP in the west-central Atlantic is a little more pesky, and can act as a deterrent for wintry weather. If it gets too close to the coast, it will try to nudge the surface low along or just inside the coast. Of course, that spells mild air and rain for NYC including S&E. The ideal track (specifically for this storm) is off the NJ coastline toward the 40/70 Benchmark (latitude/longitude). A track west of the BM threatens to keep the area too warm for snow.


Let's now look at the 500mb level using today's 12z EURO valid Saturday afternoon. At this point, the surface low is already approaching the Mid-Atlantic and precip is about to get into southern NJ. To be honest, I am not a huge fan of the look of this when it comes to classical snowstorm set-ups. The upper air energy has a strung-out look to it. You have some PvA escaping east (right black circle) and some hanging back over Ohio (left black circle). In between you are left with weak forcing and the potential to dry slot. Further, you have an upper level low circulation over the Great Lakes that is trying to keep upper level winds out of the south-southwest direction. Lastly, all that PvA draped along the southeastern U.S. and back toward Texas, is unable to consolidate into the storm because of the -WPO/-PNA set-up further west.
These are 850mb (top) and 925mb (bottom) temps valid for early Sunday morning - just as the heaviest precip moves into the area. You can see they are pretty marginal, and when you factor in surface temps well above 32 degrees, you are looking at a wet snow that will have a hard time sticking to non-grassy surfaces. These temps do eventually crash, but that is AFTER the storm undergoes cyclogenesis off the coast of NE.

Fast forward to Sunday evening, and notice how this map has completely transformed to now show a very potent 500mb low off the coast of New England. Remember, there is blocking in place (refer to MSLP map) to help slow down the flow and allow for energy consolidation near the coast. Unfortunately for us, the blocking is positioned too far north to allow for this 500mb amplification to occur at our latitude. We would want the 50/50 Low and HP to our north better positioned more south-southeast. Again, part of the blame here can be placed on the WPO ridge and trough over the western U.S. (-PNA). The upper energy does eventually consolidate, just not in time to truly benefit NYC and points S&E.
These themes I outlined are mostly consistent on other models as well, but there are some differences in the modeling when it comes to when (and how much) upper air energy consolidates. The Canadian model, for example, has much more PvA consolidation and a favorable track at our latitude. See below.

Here is the resulting snow maps for both models.
12z EURO

12z CMC

It is pretty clear - at least at this point - that central/southern NJ will struggle to see snow out of this system due to the aforementioned reasons. As for NNJ/NYC, you can see there is a pretty big difference with both models when it comes to how much snow falls. The CMC is not the most trustworthy model - and has a tendency to overamplify precip - while the EURO is known to better handle the upper level pattern with these types of storms.

I will not release a 1st call snow map just yet. There are a few more cycles of data I want to wait for. However, here is my best guess probability map for at least 3" of accumulating snow. Right now, I am favoring those NW of I-95. I will need to see significant progress in the modeling for those along I-95 to get into the heavier amounts of snow.