Wednesday, January 3, 2024

First Snowstorm of 2024

Happy New Year!


I wrote about our weather pattern going through a change after the New Year in my last blog post. I concluded that the period spanning December 30th to January 10th will be one to watch for our first snow of the season. What happens after JAN 10th remains unknown, but I do have new thoughts that I will share in the long range thread of the forum within the coming days. Low and behold, we have our first real storm threat of the season JAN 6th-7th. It is generating a lot of attention and the snow maps are trickling out daily! They are ranging anywhere from 0" to 8" for NYC. 

Let's take a deeper look into this storm's evolution. 


Here is the MSLP map according to today's 12z EURO valid for this Saturday morning. A few very important features to call out: the 50/50 low in the NW Atlantic, the High Pressure over SE Canada, and another High Pressure in the west-central Atlantic. The placement of these areas of High (or Low) pressures help dictate the eventual path of the storm, which from this map you can see is brewing in the southeastern U.S. Based on this, it will be improbable for this storm to cut west of NJ due to the pressing -EPO ridge and "blocking HP" in SE Canada. The 50/50 Low and -NAO is allowing the Canadian HP to hold position instead of trying to retreat north-northeast. This keeps our cold air in place. However, the other HP in the west-central Atlantic is a little more pesky, and can act as a deterrent for wintry weather. If it gets too close to the coast, it will try to nudge the surface low along or just inside the coast. Of course, that spells mild air and rain for NYC including S&E. The ideal track (specifically for this storm) is off the NJ coastline toward the 40/70 Benchmark (latitude/longitude). A track west of the BM threatens to keep the area too warm for snow.


It is important to mention our air mass is not incredibly cold. Here is a map of the 850mb temps valid for Saturday morning. Above the yellow line is where the northern jet is located. Notice that is also where the true arctic air mass is found. In this particular set-up, the northern jet is not really a factor. The storm is originating from the south and getting its "juice" from the El Nino-fueled sub-tropical jet stream. The air mass is considered "antecedent;" meaning; it is residual air that has been around for several days, whereas our classic snowstorms get an injection of fresh arctic air due to the northern jet phasing in polar energy.


 Let's now look at the 500mb level using today's 12z EURO valid Saturday afternoon. At this point, the surface low is already approaching the Mid-Atlantic and precip is about to get into southern NJ. To be honest, I am not a huge fan of the look of this when it comes to classical snowstorm set-ups. The upper air energy has a strung-out look to it. You have some PvA escaping east (right black circle) and some hanging back over Ohio (left black circle). In between you are left with weak forcing and the potential to dry slot. Further, you have an upper level low circulation over the Great Lakes that is trying to keep upper level winds out of the south-southwest direction. Lastly, all that PvA draped along the southeastern U.S. and back toward Texas, is unable to consolidate into the storm because of the -WPO/-PNA set-up further west. 


These are 850mb (top) and 925mb (bottom) temps valid for early Sunday morning - just as the heaviest precip moves into the area. You can see they are pretty marginal, and when you factor in surface temps well above 32 degrees, you are looking at a wet snow that will have a hard time sticking to non-grassy surfaces. These temps do eventually crash, but that is AFTER the storm undergoes cyclogenesis off the coast of NE. 


Fast forward to Sunday evening, and notice how this map has completely transformed to now show a very potent 500mb low off the coast of New England. Remember, there is blocking in place (refer to MSLP map) to help slow down the flow and allow for energy consolidation near the coast. Unfortunately for us, the blocking is positioned too far north to allow for this 500mb amplification to occur at our latitude. We would want the 50/50 Low and HP to our north better positioned more south-southeast. Again, part of the blame here can be placed on the WPO ridge and trough over the western U.S. (-PNA). The upper energy does eventually consolidate, just not in time to truly benefit NYC and points S&E. 

These themes I outlined are mostly consistent on other models as well, but there are some differences in the modeling when it comes to when (and how much) upper air energy consolidates. The Canadian model, for example, has much more PvA consolidation and a favorable track at our latitude. See below.


Here is the resulting snow maps for both models.

12z EURO


12z CMC


It is pretty clear - at least at this point - that central/southern NJ will struggle to see snow out of this system due to the aforementioned reasons. As for NNJ/NYC, you can see there is a pretty big difference with both models when it comes to how much snow falls. The CMC is not the most trustworthy model - and has a tendency to overamplify precip - while the EURO is known to better handle the upper level pattern with these types of storms.


I will not release a 1st call snow map just yet. There are a few more cycles of data I want to wait for. However, here is my best guess probability map for at least 3" of accumulating snow. Right now, I am favoring those NW of I-95. I will need to see significant progress in the modeling for those along I-95 to get into the heavier amounts of snow. 

Thursday, December 21, 2023

Pattern Change Will Try To End NYC Snow Drought

You have to go back to late January of 2022 for when NYC saw its last major snow event. It was an all-out blizzard for much of Long Island if memory serves me correctly. NYC received about 8 inches of snow, but areas to the east saw well over 12". We are approaching the 2-year mark since that event, and for some people - including myself - that is too much to bear witness to. "We want our snow, and we want it now."

The upper level weather pattern is moving in the right direction. Although the remainder of December looks quite warm from an averages standpoint, I think the way everything is unfolding will lead to colder than normal weather conditions for us in the 1st half of January. 


A look at the ECM Ensembles valid for DEC 28th already has a completely different look aloft compared to where we have been so far this month. The ridge that has been dominating the central part of this country and Canada is now shifting north and west into western Canada. This in part due to a retraction of the Pacific Jet and MJO activity through phase 8 (see below). I did mark the potential threat of an STJ (sub-tropical jet) fueled storm system which would impact our area around the 30th-31st of this month. However, I am going to hold off speaking on this particular threat until more data and model consistency becomes available. I want to keep the focus on the broader pattern for now. 


This is an OLR (outgoing longwave radiation) map valid as of yesterday. The shades of blue at 180 degrees longitude, also known as the International Dateline, and along the Equator, indicates a movement of thunderstorms propagating eastward. When the convection is concentrated in this area of the Pacific Ocean, it is often referenced by forecasters as an active MJO in phase 8. The shades of yellow/oranges/reds back toward the Asian-Pacific islands indicates suppression of convective activity due to sinking air. In the day 1 to 5 forecast, you can see the wave of tropical activity is now east of 180 degrees and closer to 150W. Normally these waves stall or die off as they approach cooler ocean temperatures. However, because we're in a basin-wide El Nino state, there may be a tendency to see these MJO waves hold on for longer than normal (warmer ocean temps). This bolds well for maintaining upper level ridging in the northern Pacific (-EPO). 

Let's advance the snapshot from late December into early January. We're now looking at JAN 2nd. The axis of the Canadian ridge has retrograded even further N&W. It is now closer to the Pacific coastline and pointed more poleward. The black arrows is meant to show the split-flow that has developed over the western U.S. The "south" side of the flow is an active train of upper level short waves (storms) riding along the STJ. The "north" side of the flow is High Pressure, or ridging, which extends all the way through western Canada and eastern Alaska. This is also known as a -EPO. What this does is promote a trough to form over the eastern CONUS, and for the arctic airmass to be displaced south into our region. The ability to tap into this cold air mass and have the STJ interact with the polar jet sets up the potential for snowstorms during this period of time. The time frame we are looking at is December 30th to January 10th. 


Where does the pattern head to after JAN 10th? That is the million dollar question. Let's now look at the second half of the OLR anomaly map I posted above. This is the 6-10 day & 11-15 day forecasts. At the 6-10 day mark, you can see we still have residual tropical activity between 180 and 150W (MJO phase 8). We also see the emergence of a new wave coming off Africa and into the Indian Ocean. If you haven't already guessed it, the MJO starts at phase 1 and ends at phase 8. Phase 1 happens to start exactly where you see the negative anomalies, around 30E. As this waves jogs eastwards over the Indian Ocean, the MJO is also moving into phases 2 & 3. The EURO MJO forecast accurately depicts that.


So we have this new wave that will take the MJO through phases 1, 2 and 3. Even though the MEAN forecast above appears to show the wave dying off around JAN 2nd, I am not sure I buy that just yet since there are plenty of other members that try to keep it active through phases 2 and 3. 

This map is meant to show what the ensuing 500mb upper level pattern should look like with an MJO in phase 1 with the Pacific basin in an El Nino state. This map looks awfully similar to the 500mb ECM Ensemble maps I posted above, doesn't it? You have that split-flow looks over the western U.S. and a trough holding strong along the eastern CONUS. 


Here is the same map but with the MJO in phase 2. This is where the pattern becomes a little fuzzy for me. The lowest anomalies are concentrated over the southern U.S. However, I think the main driver of these negative anomalies is not so much a result of a deep arctic-driven trough. Instead, a very active STJ is moving storm systems through that is keeping there weather unsettled with rain and lower than normal temperatures. Basically, do not be fooled into thinking this has the makings of latitude-wide trough that is sourced out of the arctic. You can see the ridging signal over the western U.S. and Canada that was there in phase 1 has disappeared in the phase 2 map. And if you think about how December has played out so far...Canada has been experiencing temps running above normal. During an El Nino year, it is common to see the air mass hover near normal with only "rounds" or "short lived" arctic blasts coming through. That is not to say an MJO in phase 2 cannot deliver snowfall for our area. It just means we need other features, such as a -NAO or form of blocking to our north, to be in place so that it keeps the cold air in place. 


It would not be right of me to leave out the composite map that shows a phase 3 MJO in an El Nino year. If the tropical wave thrives through phase 2 and makes it into phase 3, it should help turn the EPO from positive to negative again. This would be a favorable outcome for our area, because what we're seeing come to fruition the first 10 days of January has the chance to come back again in the middle of January. Notice the positive height anomalies across western Canada and, even more so, the east based  -NAO. 

We have a pretty good idea of where the pattern is heading from DEC 30th to JAN 10th. And depending on what happens with the "new" MJO wave that develops, we may be in decent shape from JAN 10th to JAN 20th too.

One thing I have not yet talked at length about is the state of the Stratosphere. Without sounding too technical, the Polar Vortex that exists in the Stratosphere is an important phenomena to our sensible weather here in the Troposphere during the winter months. The strength of this PV is commonly measured by the zonal-mean zonal wind at 10 hPa (pressure level) and 60 degrees north (U10-60). During the winter months, the wind at this level travels in a westerly cycle and temperatures are extremely cold. When you hear people say the "Stratosphere is going through a Sudden Stratospheric Warming" (SSW) event, it means the winds at U10-60 have reversed from westerly to easterly and temperatures are rising to anomously warm levels. The Polar Vortex reacts in 2 ways: It either gets displaced off of the Arctic and to a particular side of the Northern Hemisphere (could be North America, Asia, etc.) or it splits into two smaller vortex'. Theoretically, one vortex could go to North America and another to Asia/Europe. More often that not, a SSW often guarantees a significant pattern change to occur over North America during the winter. But is very much depends on the series of events that unfolds. Let's take a look at the EURO forecast between now and DEC 30th at 10hPa of the Stratosphere:


This is a very impressive evolution at 10hPa. In the beginning of this loop, we have a 10hPa ridge over the Northern Pacific and the Strat PV sitting just outside of the Arctic Circle. By the time we get to the end of this month, that ridge has moved into central Canada and a NEW one develops over Asia. This is known as a "wave 2" warming event at 10hPa. Both of these ridges act to "squeeze" the Strat PV, and as modeled, effectively displace it off the pole and are very close to splitting it into two vortex'. 


To reinforce this one more time, the winds are a measure of the strength of the Polar Vortex and the temperature forecasts help tell the story of how successful or unsuccessful the winds were in displacing the PV off the pole. In these maps, the purple line is the EURO forecast of both zonal wind at 10hPa and temperatures. In the wind plot, notice how the EURO is trending toward a reversal of the winds from westerly (positive) to easterly (negative). There are individual ensemble members (thin green lines) that actually show a full reversal take place before JAN 5th. Now correlate the weakening winds the EURO shows with the EURO temperature plot directly below, and you can see the rapid rise of temps leading up to JAN 5th. The EURO is well on its way to forecasting a SSW event to take place around JAN 10th +/- 5 days. However, notice how the GFS is in a camp of its own in relation to the other models. GFS is the orange line in both of the plots. It actually thinks the Strat PV will gain strength (faster westerly winds) and temperatures will stay the same or possibly get colder in the Stratosphere. As mentioned, the GFS is in a camp of its own right now, and last I checked, its own Ensembles appear to disagree with it. 

These are the possibilities:

  1. A full-out SSW takes place JAN 10th (+/- 5 days) as shown by the EURO
  2. A "temporary" SSW take place, whereby the Strat PV is temporarily displaced off the pole before settling back in once the temperatures cool again
  3. A SSW does not occur or is delayed until late JAN / early FEB
Here is where my concern lies. Let's assume #1 materializes, and a major SSW happens which either permanently displaces the PV or splits it into 2 vortex'.  If we focus back on the EURO GIF I posted, I do not like how the cold air is modeled to be on the other side of the Hemisphere. This means the arctic air gets "pushed" to Europe and Asia, while North America is left with what we have today - which is a fairly muted cold air mass over Canada. Again, this is NOT to say that we will not have cold air to work with, but if the SSW comes to fruition as currently modeled, I am not sure how much of a benefit it will have for our area. I do not think there will be a negative that comes from it, however. Our pattern would just be dictated by the AAM, MJO and overall El Nino. 

For now, let's enjoy what we have coming to us in the first 10 days of January and HOPE that we can end the NYC snow drought. I am very much looking forward to that. What happens beyond then remains "up in the air" (pun intended).

Buon Natale amici

-Francesco

Wednesday, February 28, 2018

March Roaring In - Powerful Nor'easter Taking Aim on NYC Metro

Here we are on the last day of February. The last day of Meteorological Winter. One of the last couple of days before temperatures head back south into the 40's and we have to wait for true Spring to arrive. And on this last day of February we are tracking the potential for a powerful Nor'easter to strike the area Thursday night into Friday. Heavy rain, snow, damaging winds, and coastal flooding will be on your menu come Friday.


A look at the 500mb height anomaly map valid 7am Friday will tell the story. A near record-breaking negative NAO (deep purple shade over Greenland) will cause the upper level jet stream to buckle. This causes low pressure systems to essentially cut-off at the surface and even retrograde back into the east coast instead of the typical east-northeast exit. High latitude blocking on the Atlantic and Pacific (-EPO) develops a near perfect pathway for our Nor'easter to track this way.


One reason why your local Meteorologists and others are not calling for a blizzard is because - if you look at the 500mb anomaly map again - the trough over the eastern U.S. is not deep. In other words, we're not working with an arctic air mass. Do not get me wrong...there will be snow - a lot for some - but it will not be your DC to Boston 12"+ Godzilla snowstorm. The Godzilla snow amounts will be confined to area N&W of NYC. But I am not completely ruling NYC out of a 12" storm simply because models are still trending with the exact placement of the secondary low pressure system that will develop. But I would place probability of those types of amounts at less than 10%. Notice in the 500mb vorticity map above we're seeing the 500mb low close off off the coast of NJ. At the surface, this will produce a rapidly deepening low pressure system drawing cold air into its core (or to the coast). So we're likely looking at rain changing to snow for many across NJ and NYC Metro late Thursday into FRI morning.


As cyclogenesis occurs 850mb temps will crash. These maps (EURO top and GFS bottom) illustrate that. At 7am, 850mb are at or above freezing for most but they are rapidly crashing as the morning goes on. This gives you a rough idea of when precipitation will change from rain to snow.


There is more I can go into specifics on. The evolution of the 250mb jet, how the mid level vorts (700mb, 850mb) stack, where the best frontogenesis will be, etc. Once there is clarity from the models I will expand on these things in the forum. For now, I think NYC Metro can expect a rain to snow event with at least 3 inches falling. The immediate coast, such as Jersey Shore, will primary see a high wind and coastal flooding event with snow as your "cherry on top." N&W of NYC I think could see Godzilla-type snowfall amounts if it all plays out perfectly. The primary will lend way to the secondary (energy transfer to the coast) and a huge CCB is likely to develop. Under this CCB snowfall rates could approach 2-3"/hour. Wind gusts could be an excess of 50mph at times along the coast and Long Island. I do not see much of a wind threat for those in the interior. But the north winds turning east would bring about coastal flooding so please be aware of that.

A 1st call snow map will be released tomorrow on the forum.

Happy Tracking!

Francesco Paparatto


Thursday, March 9, 2017

Possible Roidzilla Brewing

BLOG SONG "That's What I Like" by Bruno Mars

*click on images to enlarge
*turn volume up to hear music

Its been a wild winter season to say the least. Multiple days of spring-like temperatures, severe storms, occasional cold spells, and some minor to moderate snow events. Mother Nature is not ready to let winter slip away just yet. She's hinting we should prepare ourselves for a major - possibly historic - winter storm that would take place late Monday into Tuesday of next week. I know those are lofty words to read and digest in your mind, but the 500mb set-up in the atmosphere is the best its been all season if you're looking for a big winter storm. That's not to say between tonight and Tuesday models will not change. We all know changes are abound with the modeling. Which is why I stress to look at the pattern itself. 


Believe it or not, the atmosphere is already configuring itself to set up Tuesday's possible storm by late Friday. The storm we'll see tomorrow, which will drop a general 3 to 6 inches of snow, will scoot North-Northeast toward the NW Atlantic and get trapped under a blocking ridge. Better known as a   -NAO. The development of a -NAO is critical. It sets up a "traffic jam" in our atmosphere and buckles the northern jet stream so that storm systems end up slowing or even halting in their tracks. Downstream, this results in amplification of various 500mb features such as upper level ridges or troughs. With the -NAO (check out the signature ridge over Greenland), we also see a +PNA (ridge over west U.S.) and -WPO (ridge over NPAC). This trio of teleconnections are the main reason why I am excited about Tuesday's possible storm.


The first image I posted was the GEFS (GFS Ensembles) valid Friday evening. This one is the EPS (ECM Ensembles) valid Monday morning. By this point, all pieces of upper energy associated with forming Tuesday's storm are well sampled. The first thing I want to point out is the amplification out in the Pacific. That is one HECK of a ridge in the NPAC and the domino effect it has on amplifying the pattern should not be overlooked. The western ridge grows to a point of connecting, or ridge bridging, with a piece of the -NAO ridge. Anytime we see positive heights of this magnitude in the west it results in an amplifying trough over the east coast. On the Atlantic side, the -NAO helped trap a PV lobe south of Greenland (some remnant energy is there from Friday's storm too which goes to show how potent this block is), and there is confluent upper energy off the coast of eastern Canada. These features act as a block. So between the Pacific and the Atlantic, we see upper level blocking at a magnitude that has not been seen in a long time. That means *drum roll* the trough over the eastern U.S. has no choice but to amplify, consolidate upper energy at its base, and eventually turn negative. The timing at which all of this happens is critical to determining the exact track of Tuesday's storm.


The Sub-Tropical Jet streak, valid 7am Monday here, will be active and a major contributor to feeding this storm system. The dual jet streak will keep a piece of upper energy, or vort max, off the coast of North Carolina and a surface low will develop. Without blocking this surface low would usually head out to sea, but because the flow is jammed up and we have a huge and sharp 500mb trough digging into the southeast CONUS, it gets captured and tugged back to the coast. 


Here's a better look at that 500mb STJ energy off the coast of the Carolina's (#1). Also notice the Polar and Pacific energies (#3 and #2, respectively). As the western ridge amplifies on the back-side, these energies phase over the east coast and the mid level trough takes a neutral position to eventually going negatively tilted. 


By Tuesday morning, here is your neutral tilted trough on its way negative and you have a surface low near the Delmarva. Since the upper energy associated with this set-up is very strong, and we essentially saw a triple phase with all those branches of energy, the dynamics involved here are one of the mos impressive I've ever seen. Snow rates would be prolific. At a premium for sure. 


Notice how the surface low is not very strong once it gets tugged back to the Delmarva. There is another surface low on the west side of the trough that develops which signals to me models are struggling with how to handle the upper energy. To the north, there are blocking High's which means this is likely to be a long duration event IF it comes to fruition. Probably a 24+ hour snowfall. The storm has nowhere to go! 


500mb closes off Wednesday morning. Scary thing is, or I guess cool depending on your perspective, is the area still receives 1-2 FEET of snow even with an open trough. It goes to show the potential of this thing. If 500mb were to close off Tuesday morning instead, it could result in widespread 2-3 foot snowfall totals. Then again, it could also force a storm track further west, meaning a warmer solution, so for those along I-95 we may not want H5 to close off too soon. 

I am placing odds of a 6"+ snowfall (Mothrazilla) at 75%. Godzilla 40% (12"+), Roidzilla 20% (24"+), Frankzilla 5% (36"+). I am not comfortable jumping fully onboard of something historic until models resolve how they handle the phasing between the 500mb energies I discussed. Just understand the atmosphere is set up in a way that lessens the risk of a storm NOT happening. So odds of something big are the best they've been all season. 

I will continue bringing updates through the weekend on the forum. 

Best,

Francesco Paparatto


Sunday, October 30, 2016

NJ Strong 2016-2017 Winter Outlook

-Turn volume up to listen to blog song
-Click on images to enlarge for easier view

BLOG SONG: "Born Again Tomorrow" by Bon Jovi

Ciao a tutti!

Welcome to my 4th annual 2016-2017 Winter Outlook. Behind Christmas this is my favorite time of the year as I get to share my thought's about the winter forecast with you. Last winter we saw segments of cold and a blizzard - a Roidzilla - but for the most part it was mild with few snow events. At the time our atmosphere was operating under strong El Nino conditions and the Stratospheric Polar Vortex was in an anomalously strong state. The combination of the two brought above normal temperatures to much of the United States as the Sub Tropical Jet Stream flooded the country with mild air. Don't worry cold weather lovers, the past is the past. Without further adieu, let's get into this year's forecast.

In any model there are a series of inputs required in order to come out with an output. The following factors, ranging from current atmospheric or surface observations to historical data, will be my "inputs" that backup the methodology behind my winter forecast.

  1. Sea Surface Temperature (SST) Profiles
  2. Eurasian Snow Cover 
  3. State of the Stratosphere 


1. Sea Surface Temperature (SST) Profiles

Let's start off in the all important Pacific Ocean. Here are current sea surface temperature (SST) anomalies. Red shadings point to warmer than normal and blue represents colder than normal water.


We'll start at the top and work our way south then west. The deep shades of red over the Northern Pacific, in the Gulf of Alaska, points to much above normal SST's. The above normal anomalies extend from the GOA to the western coasts of Canada and the U.S. SST's that run above normal in this part of the Pacific is indicative of a positive Pacific Decadal Oscillation (+PDO). The PDO alternates between warm and cold cycles and each cycle could last as long as 20 years on average.


In the last few years there were times when the PDO looked like it was going to go back to a cold phase but it never got there. It's also important to stress that since the Equatorial Pacific, which I will talk about soon, is flipping from El Nino to La Nina that may also impact the status of the PDO in the coming months. The last time we saw a "warm blob" like that in the northern Pacific was 2013-2014. The signal that dominated our weather pattern that year was the Eastern Pacific Oscillation (EPO).


When the EPO is negative it means the northern Pacific and Alaska are dominated by an area of High Pressure. The image on the left does a nice job of detailing the affect a -EPO has on our weather pattern. If the magnitude of a -EPO is strong, that means ridging could extend as far north as the Arctic Circle and dislodge arctic air from the North Pole into the CONUS (Continental United States). The image on the right is a snapshot of the 500mb heights in the winter of 2013-2014. Positive anomalies from the Aleutians to the western U.S. (-EPO/+PNA couplet) dominated and displaced arctic air from the Pole into southern Canada and the eastern U.S.

The warmer than normal waters send a positive feedback loop into the atmosphere which promotes sinking air, or ridging to form. Therefore it is fair to assume a +PDO increases the likelihood of ridging which leads to higher 500mb heights and above normal temperatures at the surface. This ridge would be located over Alaska, western Canada, or the western U.S. depending on its orientation and strength. 


Here is an example of how a ridge, or area of High Pressure, can lead to cold weather over the central and eastern U.S. A positive Pacific North America Oscillation, or +PNA, means a ridge is presiding over the western U.S. The aforementioned +PDO suggests the PNA has a higher than normal chance of being positive this winter as opposed to negative, which would mean a trough over the western U.S. and milder weather over the east. I have high confidence the -EPO/+PNA tandem we saw in recent winters may try to return again this year, which would yield very cold weather for the central and eastern U.S. if it comes to fruition.  

El Nino Southern Oscillation (ENSO)

Last winter our pattern was dominated by a very strong El Nino. The Pacific Jet was strong and kept the overall flow progressive across the U.S. Over the course of the spring and summer we saw El Nino fade and make its transition to La Nina. The state of the ENSO is characterized by warm (El Nino) or cool (La Nina) sea surface temperatures over the Tropical Pacific. NOAA has given La Nina a 70% chance to develop this fall and a 55% chance for it to persist through the winter.

Some people may just look back at prior La Nina winters and assume that is how the upcoming winter will evolve. However, that's not how it works. For example, the winter of 2010-2011 was characterized as a moderate La Nina and Central Park, NY saw about 60" of snow. Then came the winter of 2011-2012, a weak La Nina, where Central Park, NY saw just 7" of snow and mild temperatures. Exactly how strong each event is will determine what type of influence it has on the overall pattern. Since El Nino was very strong last winter, it played an instrumental role in our weather pattern. So the real question is what intensity is La Nina likely to be at this winter?  


This is a general look of what the jet orientation looks like in a La Nina pattern. There is a trough near the Aleutian Islands, west-southwest of Alaska, and another dip in the polar jet stream over the eastern U.S. The eastern U.S. is essentially split in half. South of the jet (Mid-Atlantic) is normally drier and warmer than normal during La Nina, while north of there is wetter with temperatures around normal. I stress the exact intensity of La Nina will determine the accuracy of this depiction.


Statistical models are under the impression La Nina will peak in November and gradually rise to ENSO-neutral conditions through the winter. This would suggest ENSO is unlikely to play a key role in our winter weather pattern since neutral conditions over the Tropical Pacific do not have an influence on our winter pattern in the U.S. Instead, the factors I outlined early on in the blog such as PDO, Stratosphere, etc. would be our main drivers.

Since models are not always accurate let's look at other data that would give us an idea of La Nina's intensity this winter.


ENSO is broken into four regions. Nino region 3.4 is most important because that is the area NOAA uses to classify the ENSO as El Nino, La Nina, or La Nada (neutral). The standard of measure they use is known as Oceanic Nino Index (ONI), which measures sea surface temperature anomalies. If the 3-month running mean of the ONI is at or below -0.5*C for 5 consecutive months, that means ENSO will be classified as La Nina.


Here is a chart that plots the weekly ONI of each Nino region. Looking just in the Nino region 3.4 column over the last few weeks, it's apparent we are in a La Nina pattern but a very weak one. The week of October 5th is the 'strongest' the Nina got to at -0.9*C, but its weakened in the subsequent weeks.  Nino region 1+2 has not even maintained a colder than normal ONI. This looks more like a central to slightly west based weak La Nina judging off real-time ONI data.


Since it's not in the text data yet, I figured I'll look at how the SSTA's have progressed in the last 7 days. The deep shades of blue between the Dateline (180) and 120W over the Equator means La Nina has strengthened in the last 7 days. Another measure of intensity that would help us understand this better is the SOI, or Southern Oscillation Index, which calculates difference in pressure between Tahiti and Darwin. An SOI higher than +7 means La Nina is in a healthy state. If the SOI is +10 or higher it means La Nina has control and is in a moderate to strong level.


According to this recorder, over the last 30 days the SOI is actually negative and over the last 90 falls below the +7 threshold.

The evidence is quite clear between the statistical models and the ONI / SOI trends over the last few weeks, La Nina will remain weak and possibly dissipate by the middle to end of winter.


Indian Ocean Dipole (IOD)

Think of the IOD as the Indian Ocean's version of the ENSO. It is a measure of temperature gradients in the Arabian Sea (western Indian Ocean) and eastern Indian Ocean south of Indonesia. Depending on which side the cool and warm waters are on depends on the phase the IOD is in (positive or negative).


A positive IOD (top image) has above normal SST's in the western Indian Ocean while a negative phase (bottom image) has the warm waters in the eastern Indian Ocean. A negative IOD often forms during La Nina ENSO events.


Current SSTA's in this part of the world suggest the IOD is in a negative phase. You can clearly see the above normal water between Australia and Indonesia. In a negative phase, winds turn westerly and there is increased convection, or tropical forcing, that brings wetter than normal conditions to Australia and surrounding islands. The reason I bring up the IOD is because I think it will play a role in how the MJO, or Madden-Julian Oscillation, behaves this winter.


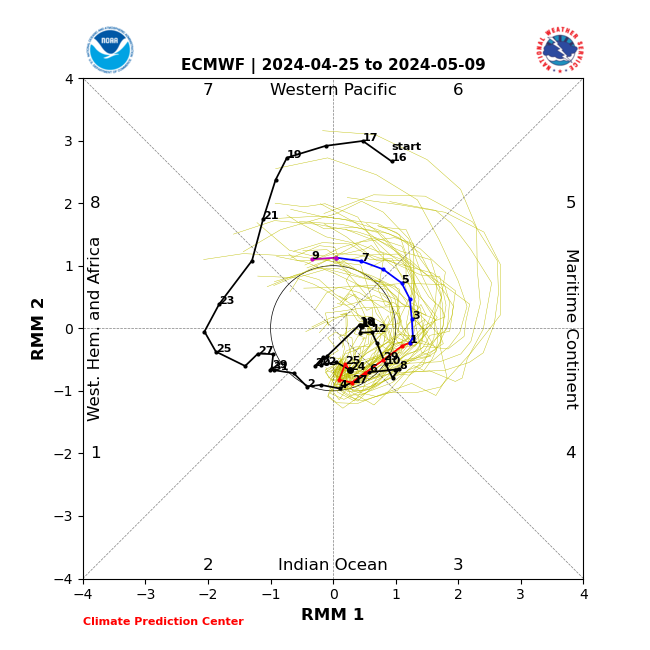
The MJO is not an easy phenomena to explain. To get a deeper understanding of this oscillation, I suggest reading Scott Dubato's explanation from the NJ Strong Weather forum. Click here. Essentially, the MJO can be in any of the above phases (1 to 8) and is defined by eastward moving "pulse" of convection across the Indian and western Pacific Ocean over the Equator. It's also important to understand that the MJO is not a seasonal feature. It is transient and usually recurs every 30 to 60 days. Phases 8-1-2 of the MJO historically points to colder than normal weather for the eastern U.S. Since the IOD is expected to be negative, convection in the form of Outgoing Longwave Radiation (OLR) is likely to develop in the eastern Indian Ocean and propagate east. The tropical forcing associated with these waves over MJO phases 8-1 (see above map) near the Dateline could enhance a ridge to form over the northern Pacific. There just happens to be a "warm blob" of SSTA's there as well (already discussed) so the probability of seeing a -EPO/+PNA couplet this winter is very high.

Let's think hypothetically and say a strong tropical wave forms in the eastern Indian Ocean and begins to propagate east. Above are 500mb height anomaly maps for the MJO in phases 8, 1, and 2 using La Nina composites. All these phases yield very cold conditions for the central and eastern U.S. It is no guarantee the MJO will be active or in any of these phases, but given current SSTA's and the IOD, I think there is a good shot.

Atlantic SST's


SSTA's in the Atlantic Ocean are also worth talking about. SSTA's in the central and western Atlantic are running well above normal. You probably remember from the summer how warm the water at the Jersey Shore was this year. Also this summer we saw the WAR (western Atlantic ridge) flex its muscles on more than one occasion. Since we still see very warm SST's in the Atlantic, and La Nina patterns have a tendency to enhance the southeastern ridge, then a very tight and noticeable gradient pattern could develop at some point this winter. This depends on how strong and south the Polar jet stream gets. The gradient between the trough caused by the dip in the polar jet and the ridge from the south could call for the development of intense low pressure systems to form. If the air is just cold enough for snow, snowfall rates could be very impressive due to the unstable atmosphere a gradient pattern creates.

2. Eurasian Snow Cover 

The purpose of discussing and analyzing the SCE (snow cover extent) and SAI (snow advanced index) in Eurasia is so we can get an idea of which phase the Arctic Oscillation (AO) will be in this winter. A negative AO displaces arctic air from the North Pole and sends it south. A positive AO keeps the arctic air bottled up in the, you guessed it, the Arctic. As long as there is a driving mechanism to bring the cold into the CONUS during negative AO episodes, such as a +PNA or -EPO, then much of the area will experience below normal temperatures when the AO is negative. Additionally, above normal SCE in Eurasia enhances feedback from the Troposphere to the Stratosphere as Rosby waves travel up our atmosphere. I will talk more about the Stratosphere and this type of interaction in the next segment.


A look at SCE in the Northern Hemisphere and Eurasia shows we're dead even compared to last year. According to Judah Cohen, a Meteorologist from AER, the faster the snow advance is in Siberia the higher the odds the AO will be negative for the ensuing winter. 

In theory, the SAI is the rate at which snow accumulates in Siberia and the SCE is how expansive the snow cover gets across Eurasia, NH, and NA. 


Here is how snow cover has progressed though October in the Northern Hemisphere. Very impressive gains in the lower latitudes of Canada and central and western portions of Siberia.


The GFS forecasts these gains to continue through the first week of November. Take a look at the green circles on the bottom image, which is snowfall depth as of November 9th. Compare that to the top image and you can see the GFS is predicting snow cover to expand in the coming days. What I am unsure about is how this compares relative to normal. However, if you are a winter weather lover I would think this news is better than the alternative. Right?

What I am encouraged by is the snow growth in Canada, which is better than last year actually. Establishing a cold air mass earlier than normal means stronger cold air masses may intrude our area at any given time this winter. The degree to how negative the AO gets also plays a role in how strong the arctic blasts will be.

I do not want to make a forecast on the AO yet until the conclusion of the next segment, the Stratosphere.

3. Stratosphere

There are two layers of the atmosphere that everyone should be familiar with. The Troposphere is the first layer and is responsible for the weather we see at the surface. Basically it's the layer of the atmosphere we live in. The Stratosphere is situated directly above the Troposphere. Air pressure in the Stratosphere ranges from 100 hPa (lower level) to 1 hPa (upper level). 10, 30, and 50 hPa is considered the 'middle' Stratosphere. Here's a visual for ya:


There are two types of Vortex. The Tropospheric and Stratospheric Vortex. The colder temperatures are in the mid-levels of the Stratosphere, the stronger the Stratospheric Vortex will be. This means the Tropospheric Vortex is also likely to be very strong. When the Vortex' are strong, the AO has a high chance of being positive. I mentioned earlier a positive AO keeps arctic air bottled up in the North Pole. The most common way to get a sustained negative AO in the Troposphere is to weaken the Stratospheric Vortex. The Quasi Biennial Oscillation (QBO) and SCE & SAI at the surface of the Troposphere are significant factors that not just help weaken the Stratospheric PV, but lead to a displacement or possible split which would have pronounced impacts on our winter weather pattern. 

Like some of the other oscillations talked about in this outlook, the QBO will be in either a positive or negative phase. The QBO measures tropical stratospheric winds that descend in an easterly then westerly direction over a 28 month period. Typically, a negative QBO (easterly winds) weakens the Stratospheric Vortex while a positive QBO (westerly winds) strengthens the Stratospheric Vortex.


Above are the September (ignore the values circled in red, that is actually August) values of the 30 and 50 hPa QBO. Both 30 and 50 hPA show the QBO to be in a westerly phase. What is interesting is at 30mb the QBO never reversed to an easterly phase over this past spring and summer. It got close but never made it all the way. One reason for that may have been because of the strong El Nino. To read more, click here. In general, strong ENSO events can lock the QBO phase and this is one reason why we're seeing unusual behavior with the Strat PV this Fall. 


The black line is where Stratospheric zonal winds should be this time of year. The purple is actual observations and orange is the forecast. I did not do the research, but I am not sure if there has ever been a time where zonal winds were this weak very early in the season. I am assuming this may have been due to the dichotomy of the QBO winds at the mid-levels, but nevertheless it's interesting and has given us a weak Stratospheric Vortex to start the year. However, you can see zonal winds are expected to intensify in the coming weeks and the Stratospheric Vortex is likely to return to a normal intensity by late November. 


Although strengthening is expected in the coming weeks, a lot of the damage has already been done. Here is a look of 30 hPa geopotential heights from the EURO valid November 1st. A huge chunk of the Stratospheric PV is over North America with positive heights building over the north Atlantic and Barring Sea. The Stratospheric PV is already in a very weak state for this time of year, and due to this anomalous warming, the end of November into December is likely to start off on the cold and possibly snowy side for our area. Effects of Stratospheric warming do not translate to the Troposphere until about 14 days after the warming event. 

Another factor that could influence the strength of the Stratospheric Vortex is the SCE and SAI across Siberia. Siberian snow cover, specifically with good depth, allows High Pressure to form over Siberia which intensifies Rosby wave breaking patterns seen from the Troposphere to the Stratosphere.


Here is a timeline put together by Cohen that shows the process that takes place between the Troposphere and Stratosphere during low or high snow cover years. From what I see with a weaker Stratospheric PV this year compared to last, interesting SST profiles in the Pacific that could lead to an active MJO, and snow cover in Eurasia continuing to expand into the first week of November, I think the AO will be in a mainly negative state this year. Therefore, a Sudden Stratospheric Warming Event has a higher than normal chance of coming to fruition. Especially if the tropical forcing over the Equator pans out and forces Rosby waves to "break"or deflect off mountain ranges and into the Stratosphere as heat flux, which leads to gradual warming in the lower and mid levels.

Official 2016-2017 Winter Forecast


NYC Metro Forecast:

For the Metro area I think we'll see a lot more cold-bred storms. This means Alberta Clippers strengthening near the coast or re-forming into Miller B coastal low's. Also, "Southwest Flow Event" storms, latitude-dependent or gradient-like storms, could be common this year as well. SWFE storms could bring intense snowfall rates if you're just north of the temperature gradient between the trough and southeast ridge. I do not expect record-breaking warmth like we saw last year, but there will be at least one mild spell around Christmas or early January.

Expect near normal snowfall and if I had to choose slightly above or below I would go with above. I would say around 30" of snow is a good bet for this winter. Temperatures will be near normal with 1 or 2 very warm periods and at least 1 very cold period. In the end, it should even to normal and if I had to choose which way they will lean I would go with slightly below normal. 

General thought's:
  • Early disruption of the Stratospheric PV will lead to below normal temperatures and early-season snowfall for much of the northern and eastern U.S. around Thanksgiving through mid-December.
  • A Sudden Stratospheric Warming Event will take place in the middle to end of January which will set the stage for extreme cold to enter the central and eastern CONUS in February.
  • Warm Atlantic sea surface temperatures and weak La Nina conditions will keep temperatures warm for the southern U.S, with the southeast ridge reaching as far north as NYC at times.
  • There will be a noticeable thaw late December or early January.
  • Godzilla storms (12"+ snowstorms) will be difficult to come by. More light to moderate events are expected.  
  • An early Spring. As early as March.


What Can Change the Outcome?

There are a few events that could take place that would change the outcome of this outlook:

  • I did not speak about the NAO at all. The North Atlantic Oscillation is another teleconnection that has direct influence over our weather pattern. In my opinion, it's one of the most challenging signals to forecast . If the NAO is in an extreme positive state, that could allow the southeast ridge to overpower the east and keep us mild. The only way to combat that would be for the EPO & AO to be negative so the northern trough keeps the SE ridge muted. 
  • The Sudden Stratospheric Warming Event fails, or the PV ends up on the wrong side of the globe. Sometimes SSWE displace the PV in a spot that would not bring any impacts to our area. This is why a wave 2 warming event, or a split of the Strat PV, are preferable. 
  • The MJO stays in the "circle of death" or inactive. That means tropical forcing won't be as prevalent and with a cooling trend in the PDO in the Northern Pacific, I would be considered of a +EPO which would make for a hard time trying to get cold air into the central and eastern CONUS.  
The last point is the one I am most concerned about. It will be interesting to see how the tropical forcing comes together since La Nina is expected to peak in November. Hopefully the -IOD is able to drive convection across the favorable MJO regions. 


I hope you enjoyed reading this year's winter outlook. Please click here to join the forum and become part of our community.

Thanks for reading.

Best,

Frank Paparatto