The upper level weather pattern is moving in the right direction. Although the remainder of December looks quite warm from an averages standpoint, I think the way everything is unfolding will lead to colder than normal weather conditions for us in the 1st half of January.

A look at the ECM Ensembles valid for DEC 28th already has a completely different look aloft compared to where we have been so far this month. The ridge that has been dominating the central part of this country and Canada is now shifting north and west into western Canada. This in part due to a retraction of the Pacific Jet and MJO activity through phase 8 (see below). I did mark the potential threat of an STJ (sub-tropical jet) fueled storm system which would impact our area around the 30th-31st of this month. However, I am going to hold off speaking on this particular threat until more data and model consistency becomes available. I want to keep the focus on the broader pattern for now.

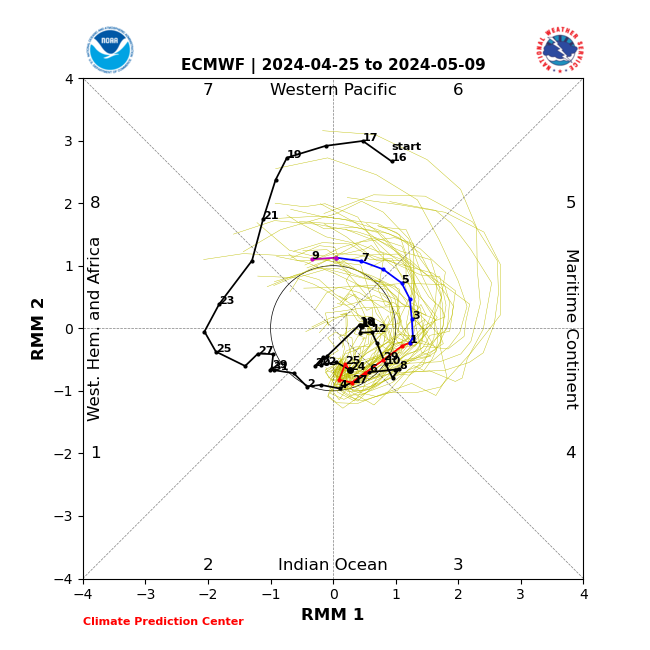
This is an OLR (outgoing longwave radiation) map valid as of yesterday. The shades of blue at 180 degrees longitude, also known as the International Dateline, and along the Equator, indicates a movement of thunderstorms propagating eastward. When the convection is concentrated in this area of the Pacific Ocean, it is often referenced by forecasters as an active MJO in phase 8. The shades of yellow/oranges/reds back toward the Asian-Pacific islands indicates suppression of convective activity due to sinking air. In the day 1 to 5 forecast, you can see the wave of tropical activity is now east of 180 degrees and closer to 150W. Normally these waves stall or die off as they approach cooler ocean temperatures. However, because we're in a basin-wide El Nino state, there may be a tendency to see these MJO waves hold on for longer than normal (warmer ocean temps). This bolds well for maintaining upper level ridging in the northern Pacific (-EPO).

Let's advance the snapshot from late December into early January. We're now looking at JAN 2nd. The axis of the Canadian ridge has retrograded even further N&W. It is now closer to the Pacific coastline and pointed more poleward. The black arrows is meant to show the split-flow that has developed over the western U.S. The "south" side of the flow is an active train of upper level short waves (storms) riding along the STJ. The "north" side of the flow is High Pressure, or ridging, which extends all the way through western Canada and eastern Alaska. This is also known as a -EPO. What this does is promote a trough to form over the eastern CONUS, and for the arctic airmass to be displaced south into our region. The ability to tap into this cold air mass and have the STJ interact with the polar jet sets up the potential for snowstorms during this period of time. The time frame we are looking at is December 30th to January 10th.

Where does the pattern head to after JAN 10th? That is the million dollar question. Let's now look at the second half of the OLR anomaly map I posted above. This is the 6-10 day & 11-15 day forecasts. At the 6-10 day mark, you can see we still have residual tropical activity between 180 and 150W (MJO phase 8). We also see the emergence of a new wave coming off Africa and into the Indian Ocean. If you haven't already guessed it, the MJO starts at phase 1 and ends at phase 8. Phase 1 happens to start exactly where you see the negative anomalies, around 30E. As this waves jogs eastwards over the Indian Ocean, the MJO is also moving into phases 2 & 3. The EURO MJO forecast accurately depicts that.
So we have this new wave that will take the MJO through phases 1, 2 and 3. Even though the MEAN forecast above appears to show the wave dying off around JAN 2nd, I am not sure I buy that just yet since there are plenty of other members that try to keep it active through phases 2 and 3.
This map is meant to show what the ensuing 500mb upper level pattern should look like with an MJO in phase 1 with the Pacific basin in an El Nino state. This map looks awfully similar to the 500mb ECM Ensemble maps I posted above, doesn't it? You have that split-flow looks over the western U.S. and a trough holding strong along the eastern CONUS.
Here is the same map but with the MJO in phase 2. This is where the pattern becomes a little fuzzy for me. The lowest anomalies are concentrated over the southern U.S. However, I think the main driver of these negative anomalies is not so much a result of a deep arctic-driven trough. Instead, a very active STJ is moving storm systems through that is keeping there weather unsettled with rain and lower than normal temperatures. Basically, do not be fooled into thinking this has the makings of latitude-wide trough that is sourced out of the arctic. You can see the ridging signal over the western U.S. and Canada that was there in phase 1 has disappeared in the phase 2 map. And if you think about how December has played out so far...Canada has been experiencing temps running above normal. During an El Nino year, it is common to see the air mass hover near normal with only "rounds" or "short lived" arctic blasts coming through. That is not to say an MJO in phase 2 cannot deliver snowfall for our area. It just means we need other features, such as a -NAO or form of blocking to our north, to be in place so that it keeps the cold air in place.
It would not be right of me to leave out the composite map that shows a phase 3 MJO in an El Nino year. If the tropical wave thrives through phase 2 and makes it into phase 3, it should help turn the EPO from positive to negative again. This would be a favorable outcome for our area, because what we're seeing come to fruition the first 10 days of January has the chance to come back again in the middle of January. Notice the positive height anomalies across western Canada and, even more so, the east based -NAO.
One thing I have not yet talked at length about is the state of the Stratosphere. Without sounding too technical, the Polar Vortex that exists in the Stratosphere is an important phenomena to our sensible weather here in the Troposphere during the winter months. The strength of this PV is commonly measured by the zonal-mean zonal wind at 10 hPa (pressure level) and 60 degrees north (U10-60). During the winter months, the wind at this level travels in a westerly cycle and temperatures are extremely cold. When you hear people say the "Stratosphere is going through a Sudden Stratospheric Warming" (SSW) event, it means the winds at U10-60 have reversed from westerly to easterly and temperatures are rising to anomously warm levels. The Polar Vortex reacts in 2 ways: It either gets displaced off of the Arctic and to a particular side of the Northern Hemisphere (could be North America, Asia, etc.) or it splits into two smaller vortex'. Theoretically, one vortex could go to North America and another to Asia/Europe. More often that not, a SSW often guarantees a significant pattern change to occur over North America during the winter. But is very much depends on the series of events that unfolds. Let's take a look at the EURO forecast between now and DEC 30th at 10hPa of the Stratosphere:

This is a very impressive evolution at 10hPa. In the beginning of this loop, we have a 10hPa ridge over the Northern Pacific and the Strat PV sitting just outside of the Arctic Circle. By the time we get to the end of this month, that ridge has moved into central Canada and a NEW one develops over Asia. This is known as a "wave 2" warming event at 10hPa. Both of these ridges act to "squeeze" the Strat PV, and as modeled, effectively displace it off the pole and are very close to splitting it into two vortex'.

To reinforce this one more time, the winds are a measure of the strength of the Polar Vortex and the temperature forecasts help tell the story of how successful or unsuccessful the winds were in displacing the PV off the pole. In these maps, the purple line is the EURO forecast of both zonal wind at 10hPa and temperatures. In the wind plot, notice how the EURO is trending toward a reversal of the winds from westerly (positive) to easterly (negative). There are individual ensemble members (thin green lines) that actually show a full reversal take place before JAN 5th. Now correlate the weakening winds the EURO shows with the EURO temperature plot directly below, and you can see the rapid rise of temps leading up to JAN 5th. The EURO is well on its way to forecasting a SSW event to take place around JAN 10th +/- 5 days. However, notice how the GFS is in a camp of its own in relation to the other models. GFS is the orange line in both of the plots. It actually thinks the Strat PV will gain strength (faster westerly winds) and temperatures will stay the same or possibly get colder in the Stratosphere. As mentioned, the GFS is in a camp of its own right now, and last I checked, its own Ensembles appear to disagree with it.
These are the possibilities:
- A full-out SSW takes place JAN 10th (+/- 5 days) as shown by the EURO
- A "temporary" SSW take place, whereby the Strat PV is temporarily displaced off the pole before settling back in once the temperatures cool again
- A SSW does not occur or is delayed until late JAN / early FEB