Sunday, January 24, 2016

January 23, 2016 Roidzilla Storm In Review

Most people before this blockbuster storm went this winter without seeing a single snowflake or a very minor snow accumulation. 10 days ago long range guidance began hinting the possibility of a powerful east coast storm effecting the area around this time. Given the lackluster season not many thought much of it. "El Nino is too strong," "the Stratosphere is too cold," and "it's already the end of January" were some of the common phrases I've heard across the weather community. Spirits of snow enthusiasts were down and all hope of an above average snowfall season - which seemingly every Meteorologist forecasted in their Winter Outlook - was lost.

As time passed weather models started showing unprecedented and unparalleled consistency that a big time coastal storm capable of dropping historic snow amounts will in fact track up the coast between January 21st and 22nd. Exactly a week ago the EURO, GFS, CMC, NAVGEM, JMA, UKMET models were all showing that. However, as the week went on and we were within 3-5 days from potential impact, the aforementioned models trended south with the storm track which kept the crippling impacts contained to the Mid-Atlantic region. They also pushed back the start date from the 22nd to the 23rd which is also not a great sign when tracking east coast Nor'easters because it gives the pattern a chance to break. Suddenly the extraordinary consistency we once saw was gone and the NYC Metro area was no longer in the cross-hairs of this beast. Weather forecast hobbyist such as myself did not completely buy into this trend. It was in my January 17th Mo Mo (Monday Morning) blog that I highlighted the upper level pattern and possible scenario's. As the week grew older it became clear the global models were suffering from convective feedback while the mesoscale models kept a surface low closer to the coast drawing plenty of moisture northward to bring a historic snowfall. The extreme upper level dynamics and complex set-up were too much for global models to handle. It was not until Thursday night or early Friday that I had full confidence a Godzilla was coming.


Here are a couple of graphics from the January 17th Mo Mo. It was clear at the time a big east coast snowstorm was possible because the ingredients were all there...a "recipe for Godzilla" one could say. It was just a matter of determining how they all come together.


I then put together 3 scenario's this storm could take. While this storm did not play out exactly as described above, it was close. The 500mb low actually followed a track similar to what's outlined. The surface low developed off the coast of NC and tracked due north tucking and stalling into the Delmarva before heading east-northeast. 


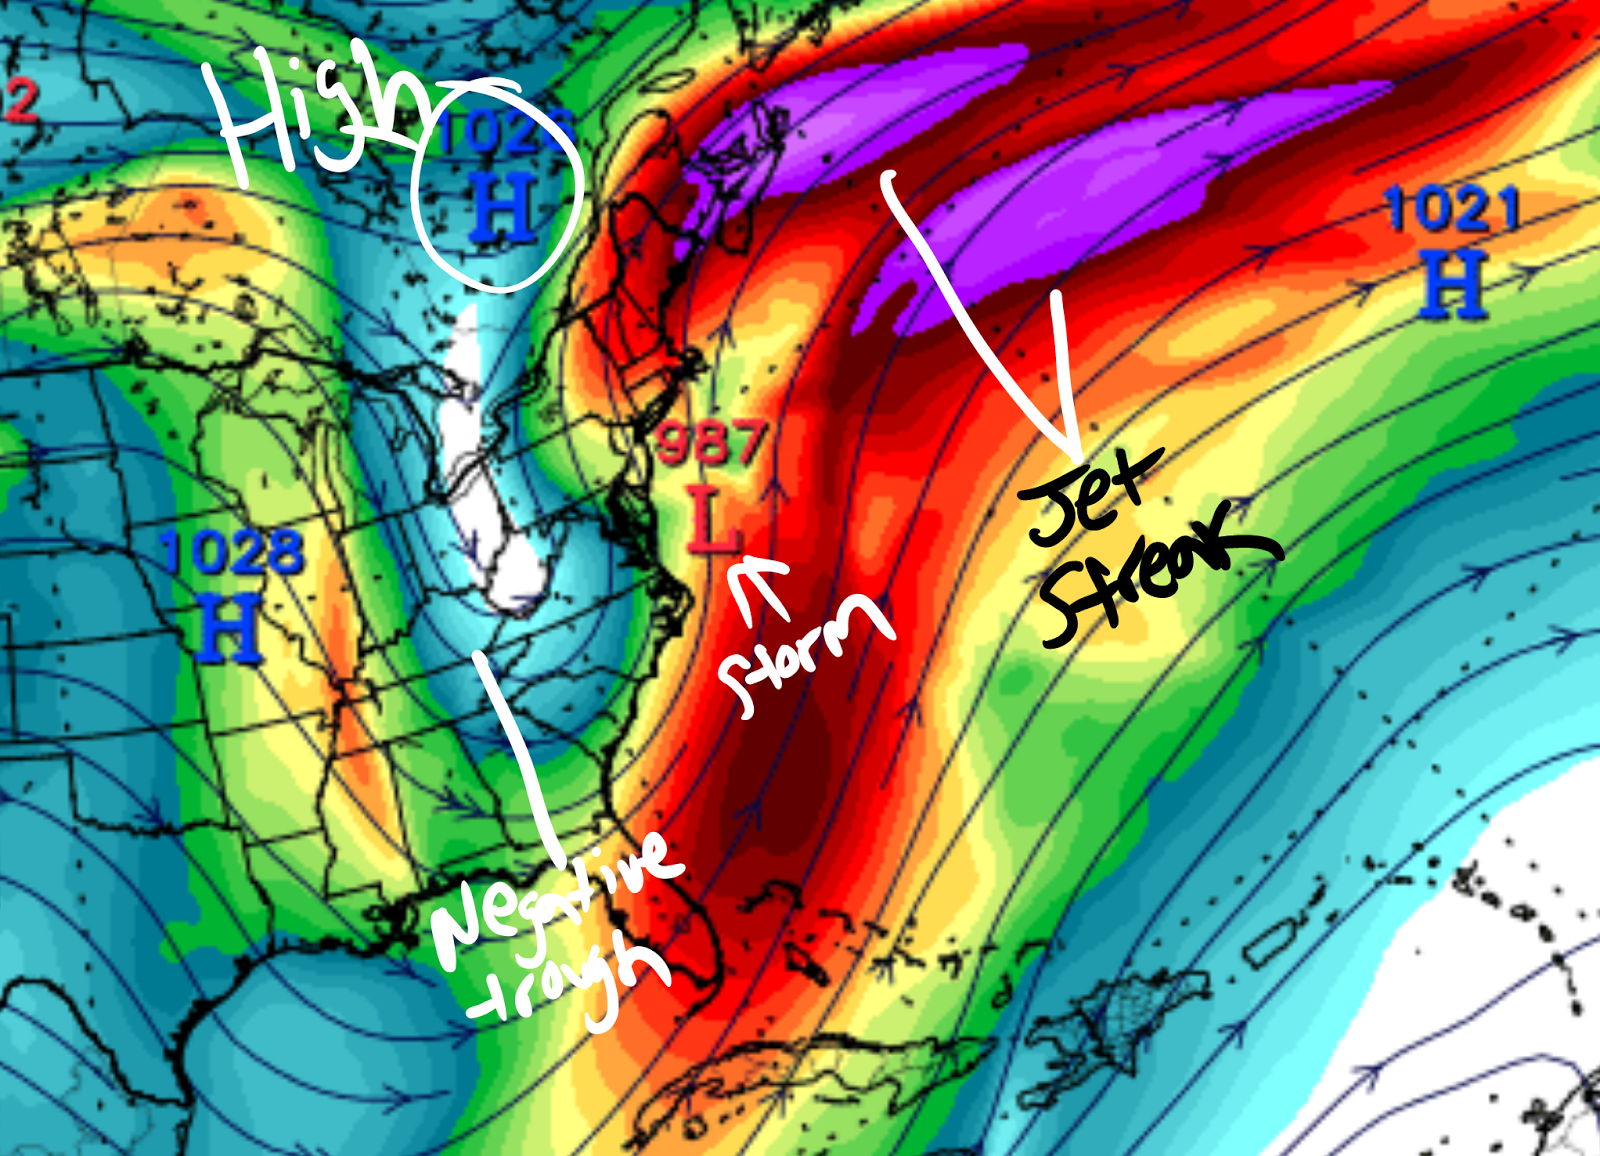
The 500mb low, Sub-Tropical Jet Stream, and above normal Atlantic sea surface temperatures played critical roles in getting the surface low to track as far north as it did and - most importantly - pivoting snow bands into the NYC Metro area. Reality is the global models DID agree with the mesoscale models where the surface low will track but the difference was the mescoscale models tucked and stalled the low near Delmarva while the globals tried to transfer energy to a second low well off the coast. The STJ is enhanced from the strong El Nino conditions over the Tropical Pacific. You can see in the first image how far west the STJ extends. The storm was being fed energy from the Tropical Pacific AND Tropical Atlantic (second image). Mild Caribbean air was being drawn into the core of the surface low which developed a lot of convection on the east side of the trough. This is partly the reason why global modeled kept "jumping" the surface low from Delmarva to 150-200 miles east into the Atlantic. With the 500mb low south-southwest of us, it does not make sense to see a surface low so far off the coast. Instead, it should remain near the coast as bands of heavy precipitation rotate into the area. 


Here is how the GFS (top) and EURO (bottom) models handled the storm 12-24 hours before impact. Both models agreed the crippling snowfall accumulations will be contained from Washington D.C. - Philly Metro - and southern NJ. Notice what they do with the surface low pressure. It's off the coast of VA/DE but a couple of frames later they re-develop it well off the coast southeast of the Benchmark. They are taking it where all the enhanced convection from the Atlantic feed is. 


Meanwhile, the NAM at the same time was doing the complete opposite. Despite all the convection on the east side of the trough the model still kept the surface low close to the coast while pivoting prolific snow bands into the area. The NAM had support from the SREFS and RPM models - two other mesoscale models. The RGEM did not jump on board until the 12z Friday run. The track of the H5 low being further north than where the global models had it immensely helped with its almost perfect verification. Syoptically it made sense. The warm SST's in the Gulf of Mexico and raging STJ does not support an H5 low digging into the southeast as much as the EURO showed. Also, the western ridge was oriented SW to NE more than N to S and began propagating east due to a s/w crashing into the west coast. In the end, the NAM and other mesoscale models saw these features the best and they not only won the battle but also the war against global models. 


The above map is observed and reported snow totals. The bottom map is my final snow prediction map. My map did very well in some areas but also poor for others. The difficulty was trying to forecast where the cut-offs will be. In the back of my mind I felt the NAM had the right idea but may have been too bullish with how far N&W it was showing the snow bands get considering the surface low is way down off the Delmarva! The enhanced dynamics from the northern and southern jets allowed these bands to get as far north as they did. Some of those bands dropped 3-4" of snow an HOUR. Given the complexity of the situation I will give myself a B-. Any other event probably a C. 


Here is an animation and radarscope image of some of the banding that took place. The bulls-eye ended up being from east-central PA to the NYC Metro area. Some towns saw snow totals exceeding 30 inches with drifts as high as 6-8 feet from the wind. 

Here are some photos from my home. Cranford, NJ - 30 inches. 


Everyone will have their own opinion on where this storm ranks in their personal list of memorable snowstorms. For me this definitely ranks #1. I do not remember the Blizzard of 96' and Boxing Day 2010 happened overnight in a 10-12 hour span effecting a smaller area compared to this storm. I come out of every winter a stronger and more capable forecaster because of the people I share this passion with. There are great minds and passionate enthusiast's out there who make this hobby worth the time I put into it day in and day out. I come out of every winter learning something new and gaining a better understanding winter weather forecasting. The Blizzard of 2016 will forever be coined the Roidzilla of 2016. I look forward to tracking the next one with you all. 

Time to dig out. 

Best,

Francesco Paparatto 

______________________________________________________


Sunday, January 17, 2016

Watching January 22nd-23rd Potential East Coast Godzilla Storm

A lot of buzz was generated this weekend after multiple weather models outputted a monster East Coast Nor'easter next weekend. A strong piece of upper level energy will enter the west coast of the U.S. in the middle of this week. As it tracks out of the Rockies and into the Southeast, it will strengthen and produce a surface low. This storm will either track into our area or exit stage right out to sea. Let's examine the setup and see why models are showing such an explosive system. 


When I look at 500mb height anomalies it is mainly to see where the "players on the field" are. This phrase simply means I am looking to see how certain atmospheric features come together because that will determine the track of the storm. Here we are Wednesday morning and you will notice both the GFS and EURO show the same players. How they handle each anomaly will dictate the track, strength, and duration of this possible storm. The main piece of upper energy - the key ingredient to the storm - is located in the PAC NW. This winter we have been killed by either a progressive flow across the country or an amplified southeast ridge. The anomalous trough south of Greenland will help combat this issue. This ULL will act as our 50/50 Low. It is able to maintain its position instead of tracking into the Arctic because there is a -AO/-NAO block in place. The only difference between both models at this time frame is the GFS has a robust lead energy over the Midwest. This clipper-like system will get absorbed by the 50/50 Low which will help to enhance it. 


Fast forward to Friday morning and you will notice both models still have the same general idea. The H5 low closes off near the TN valley and spawns a surface low that tracks north as a result of the rising heights ahead of the mean trough. Once it "feels" the block over southern Canada, it transfers energy and tracks a storm up the coast. The trough  off the west coast of the U.S. is key because it helps pump a +PNA ridge that turns the flow from zonal to meridonial. Upper air vorticity is able to dig into the mean trough and begin turning it from positive to neutral then eventually negative. 


The 500mb height anomalies look pretty similar at this juncture. Obviously there are some differences but they are relatively minor. Where I see the biggest spread between these two models is when examining 500mb vort maps. 

Similarities:

1. Western Ridge 
2. Positively tilted trough 
3. Lead energy (Clipper) is exiting the U.S. 
4. 50/50 Block 

Differences: 

1. PVA (Positive Vorticity Advection) in the trough is stronger on the GFS. 
2. The GFS has a northern s/w over the Great Lakes and the EURO does not. 

Analysis:

The GFS may have stronger vorticity embedded inside the trough but I like how the EURO consolidates it more toward the base. When energy is evenly distributed along the trough it signals for a more organized system at the surface. Also, the EURO does not have the northern s/w the GFS has over the Great Lakes. This piece of energy, which you will see in future panels, phases into the mean trough but it further complicates the phase. 


Similarities: 

1. Western Ridge - though EURO is more amplified with it

Differences: 

1. The trough is sharper and stronger on the GFS while the EURO is a bit more positively tilted
2. GFS is beginning to phase in the Great Lakes s/w while EURO has already completed the phasing process 

Analysis:

It is amazing to me how the GFS shows a very nice looking trough with tons of upper level energy dug in, but it is the EURO that ends up showing the more potent storm at the surface. There is other reasons for that - such as the 250mb jet streaks - but looking strictly at H5 vort maps one may not think that. The key reason is because the GFS is not handling the upper air energy correctly. Notice the EURO outputs a broadened trough while the GFS is a bit more closed. 


Similarities: 

1. Closed H5 Low

Differences:

1. EURO has semblance of western ridge while GFS went flat
2. Trough orientation is a bit more negative on the EURO while GFS stays neutral

Analysis:

Come Saturday morning and the EURO is the one that maintains its composure with the overall setup of the storm. The trough closes off and the low slowly tracks up the coast. There is a trough off the west coast which helps maintain a ridge over the center of the country. This ensures the H5 low will not track so easily out to sea. Instead, it has nowhere to go but north since we have blocking in the high latitudes that is slowing down the flow downstream. The block and amplified pattern helps turn the trough from neutral to negative. Meanwhile, the GFS is trying to decide whether the H5 low should remain closed  or open. It also kills the ridge which keeps the storm track a bit further east compared to other guidance that have it closer to the coast bringing heavy snow even to inland areas of the northeast. 


Here is another look at the EURO except this time using the 250mb maps which show where the upper level jet streaks are during the storm. The reason why the EURO has such an expansive precipitation shield, a deep low pressure system, and a track closer to the coast is because of the jet streaks located north and east of the storm. The trough goes negative and the storm strengthens as it does so. A nice High to the north feeds the storm with cold air to pull into the coast. 

Storm Track Possible Scenario's


There may be other scenarios that make up a hybrid of the above, but these are the main tracks this system will take. At this time I am not really leaning one way or another. The Pacific short wave we're most interested in is located somewhere over the central Pacific Ocean. I will say there is strong Ensemble support for a storm to track up the coast and the models over the weekend showed great consistency. I would be surprised if scenario #1 comes to fruition and this will happen if the western ridge does not amplify enough and the flow remains fast. However, I think the potent Pacific short wave will raise heights on its own ahead of the trough and the high latitude blocking will slow down the flow downstream enough to track a storm up the coast. The 50/50 Low is also very impressive. I will revisit these scenarios again tomorrow and possibly make a decision of which way I am learning. For now, this is where we stand. The trends over the next few days should be very interesting. The ceiling for this system is it can reach Roidzilla status - which is a 24"+ snowstorm. If this all comes together just right areas could achieve their seasonal snowfall average all in one storm. Amazing. 

Have a great week! 

Best,

Francesco Paparatto 
_________________________________________________________________________________
Follow the forum to get hourly updates: 

www.njstrongweatherforum.com 


Tuesday, January 12, 2016

January Pattern / Stratosphere Update

Lots of chatter today across the weather world about winter possibly being "over" despite most forecasts calling for an active back end. No one said it will be easy to flip the pattern driven by a strong El Nino and a dominant Stratospheric PV. It was always supposed to be a step-down pattern change and I still think we're heading in that direction. People are frustrated and they have every reason to. We seem to have the cold before and after storm events but unfortunate timing and tendency for short waves to cut-off in our atmosphere puts us on the mild side. When the Atlantic and Arctic teleconnectors turned favorable, the Pacific one's turned unfavorable. Can we get the stars to align for us in February? I think we have a fighting chance still.

We're seeing our first real signs of warming in the Stratosphere entering 10hPa and the upper levels. If this occurs, we'll see a Sudden Stratospheric Warming Event take place and displace the Strat PV to eastern Europe. This opens the door for blocking to re-develop in the AO and NAO domains sometime in February (thinking the 7th-10th). The AO should go negative sooner than the 7th, possibly sometime in the first week of the month.


The GFS and GEFS are in fair agreement 10mb and 50mb zonal mean zonal winds will dip below 10m/s for the first time this season. This is a step in the right direction as it indicates a dramatically weakening PV.


The GEFS and EPS are also in agreement of showing impressive 10hPa height extension into the Arctic and displacing the PV. While the model agreement is nice to see, I would like to see how this looks over the weekend. For whatever it's worth. Judah Cohen is confident the upcoming Rosby Wave attack will lead to a SSWE.


The Euro Ensembles on MLK Day show the impressive -NAO block but finally take the PV lobe that was over southern Canada and dig it into the northeast U.S. If the trough goes negative or there's any southern stream phasing, we could see an inverted trough develop along the coast which would promote widespread snow to break out over the area. We'll see how this trends over the upcoming days. Regardless, it'd going to get cold.


Beyond then, the EPS suggest the end of next week will still remain colder than normal with a trough over the east. Unfortunately the Pacific still does not look quite right with the trough just off the west coast. But if we have the blocking over southeast Canada into Davis Strait then maybe we can prevent another storm from cutting on us.


The last week of January I think we'll enter a reload period. The western trough enters the US and a western Canadian ridge develops overtop. This is similar to what we saw earlier in January. With the trough over the west, the southeast ridge will amplify on the east. So, if we do not capitalize on anything between now and the last week of January...we could very well head into February still looking for our first significant snowfall of the season. We have to capitalize on the blocking now before the western trough comes onshore. Like I mentioned before, we need timing and upper air energies to cooperate.

I touched on February in the Stratospheric portion of the writeup, but I will have a February outlook out sometime in late January letting you know whether or not I still feel Central Park, NY will finish the season with above normal snowfall. Yes, I'm going to tell you if my Winter Outlook still has a chance of verifying (from a snowfall standpoint, I'm doing OK with temps so far). Hopefully we start getting some good news around here!

Best,

Francesco Paparatto

Sunday, January 10, 2016

01/11/16 Mo Mo: January 17th-18th Storm Potential

Click on images to enlarge

Most winter weather enthusiast are at the point where if they do not see snow in the near future they're ready to give up and look forward to spring. The frustration is warranted after the record warm December and 60-degree day yesterday. I still think this will be a tale of two seasons - I've been consistent on this since my Winter Outlook. December was forecasted to be above normal, January is transition with mild and cold stretches, and February will be the cold / snowy month possibly lasting into March. 

In the 2nd full week of January we could see snow showers late Tuesday or early Wednesday from a weak arctic front that forms ahead of a Clipper. As the Clipper tracks northeast into Canada it will phase with another piece of energy and deepen into a powerful low pressure system. This eventually turns into a closed low and becomes our 50-50 Low for a possible winter storm to effect our area between January 17th-18th. A 50-50 Low is located around 50N latitude and 50W longitude. Its purpose in winter storm setups is to keep cold air in place by preventing High Pressure systems from escaping east and keeping winds in a NW direction. 

The next series of images will be the Sunday 12z runs of the GFS and EURO OP models looking at the 17th-18th time frame. The images on the left are the GFS and right will be the EURO. There are 4 key features that I will be comparing and contrasting between both sets of models:

1. The 50/50 Low 
2. Northern ULL 
3. Southern Energy
4. Western Ridge 


Valid 7am Thursday

1. The 50/50 Low: Both models have it located over SE Canada
2. Northern ULL: Both models have it located SW of Hudson Bay
3. Southern Energy: Both models have the southern s/w (short wave) located over SW U.S. 
4. Western Ridge: Both models do NOT show a western ridge at this time. The flow is fast. 

Summary: 
By 7am Thursday we see both models have the location of the Wednesday Clipper over SE Canada. SW of Hudson Bay there is an Upper Level Low that is trying to detach itself from the northern jet.  Over in the Pacific there are two short waves entering the west coast. The GFS is a little faster with the second short wave over the eastern Pacific compared to the EURO. Overall, both models have a similar look Thursday morning. 


Valid 7pm Friday

1. The 50/50 Low: Both models maintain the same location of the 50/50 Low since Thurs. morning
2. Northern ULL: Both models bring the ULL further south. 
3. Southern Energy: The GFS has 3 separate s/w's from the Rockies to Atlanta, GA. The EURO attempts to consolidate these short waves into the base of a trough. 
4. Western Ridge: The GFS shows a muted ridge. The EURO shows an amplifying ridge. 

Summary:
The GFS and EURO begin to differ as we fast forward to Friday evening. The GFS has a less defined / weaker western ridge because it shows another piece of Pacific energy getting ready to crash into the west coast. On the other hand, the EURO has an amplifying western ridge because of the location and strength of the NPAC trough helping to pump heights. Furthermore, the GFS keeps the 3 southern s/w's separated while the EURO tries to consolidate them into the base of a trough. This makes sense since the amplifying western ridge allows Pacific energy to dig deeper into the U.S. 


Valid 7am Sunday 01/17

1. The 50/50 Low: Both models begin to shift the 50-50 Low N&E. 
2. Northern ULL: The GFS has the ULL in southern CA while the EURO digs into the eastern U.S. 
3. Southern Energy: The GFS has nice consolidation of southern energy at base of trough while EURO has the vorticity elongated along the trough. 
4. Western Ridge: The GFS loses the ridge while EURO shifts it east. 

Summary:
The GFS has a nice looking trough even though it collapsed the western ridge. The problem is the northern ULL did not dig into the CONUS so the air mass is too mild to promote wintry weather. On the EURO, the ULL is digging further than the GFS but the western ridge is not poleward enough to force the ULL to phase with the southern energy. The end result on both models is a weak surface low off the coast with marginal cold in place. 


GFS and EURO Ensembles Valid 7am Saturday

The 500mb height anomalies bring to light the upper air features a little better. The Ensembles suggest the ingredients to getting an east coast snowstorm are very close to coming together. I think the biggest problem is the western ridge. The GEFS show the NPAC trough closer to the west coast compared to the EPS but both sets are not enthused with maintaining amplification of the ridge. This means the northern ULL stays around the Great Lakes and fails to phase with the southern energy, thus keeping our air mass mild and preventing cyclogenesis from occurring. Also of concern is the 50-50 low tries to depart the 50-50 region too quickly. This suggests the -NAO block is transient and the overall flow across the U.S. stays progressive. The only way to combat the transient -NAO block is for the western ridge to amplify so both northern and southern jets can phase. This is how we've gotten storm systems off the coast the last two winters. NOT relying on a -NAO block, rather on a +PNA/-EPO couplet. 

Final Thoughts

I think we're still far off from seeing the final solution on the models. Sampling with the Pacific energies is very poor and the 50-50 Low does not even exist. That said, I do not like the trends I saw from models over the weekend. The -NAO block is either weaker or shown to dissipate, the western ridge amplifies for a short period of time before collapsing, and the northern energy is closing off in southern Canada (south of the block). I highly prefer an open wave of northern energy because it has a better chance of digging into the CONUS and replenishing our air mass with arctic cold and phasing with southern energy. If we can reverse the trends on those 3 features, we'll begin to see solutions on models showing an east coast snowstorm. Does the overall pattern favor those 3 features to reverse or stay as currently modeled? Well, 200hPa anomalies are forecasted to go negative around 160W in the Equatorial Pacific. This should keep the NPAC trough further west than where models show it, which in turn should keep the western ridge amplified. There is a lot to track over the next few days. We'll see where this goes... 

Have a great week! 

Best,

Francesco Paparatto 


Wednesday, January 6, 2016

Full-Scale Pattern Change Possible Sooner Than Expected

A couple Monday's ago I revealed my timeline to when I think our abysmal weather pattern will break into a more favorable one for sustained cold and snow chances. I said the first 2 weeks of January will be mainly transitional with a possible "relaxation" around mid-month and a full-scale change by week 4. If today's guidance is any indication of what could be coming in the medium to long range, then this timeline will be moved up by about 1 week. 


Here are the Sea Surface Temp Anomalies of the Pacific and western Atlantic. Not much has changed since I released my Winter Outlook. El Nino peaked and is gradually weakening. The positive anomalies in the east-central ENSO regions are not as anomalous as they were 2-3 weeks ago. The above normal SSTA's off the west coast indicate the +PDO signal is still strong. The waters around the Aleutians are actually cooling. This is not surprising since this area of the Pacific has been under below normal heights for the last couple of weeks. The cool NW and warm NE Pacific SSTA's supports trough-ridge configuration to remain intact for the foreseeable future. However, since the Aleutian trough is modeled to be oriented from NW to SE, parts of it drifts into the eastern Pacific which pushes the ridge over the western U.S. (+PNA). Most importantly, the Aleutian trough helps build heights in the EPO domain extending positive heights into the western Arctic. The -EPO/-AO couplet could reach strong levels by the middle of the month. 


The main reason why we could see the EPO and AO get to moderate-strong negative levels is due to where the Tropical Forcing sets up over the Equatorial Pacific. Not only where it sets up, but the magnitude it exhibits will also influence our upper level pattern. The CFS forecast of the MJO from Kyle MacRitchie shows a very amplified wave forecasted to propagate through phases 7-8-1-2. The EURO forecast of the MJO is not far off. It also shows a moderately amplified MJO wave going through phases 7-8-1-2, but it loses some intensity once it reaches phases 1-2. Meanwhile, 850mb zonal wind anomalies are showing extreme levels of westerly winds just east of the International Dateline. Not coincidental, OLR anomalies are also expected to be negative over the same area. 

Key Points

1. The strong easterlies (blue color) on the left correspond to suppressed convection / less precipitation (brown color) on the right around 120E. 

2. The strong westerlies (red color) on the left correspond to enhanced convection / greater rainfall (blue color) on the right between 180 and 150W. 

3. The location of the -OLR anomalies and 850mb WWB's suggests the North Pacific trough should be located between 180 and 150W, or just S-SE of the Aleutians which is where the negative SSTA's are located. Rising air associated with enhanced convection, or thunderstorms, helps keep the trough in place over the aforementioned area while a ridge develops over the EPO/PNA domains. 


The CFS keeps the -OLR anomalies between 180 and 150W into early February. In light of these developments, I expect the NPAC trough to remain over or just south of the Aleutians with continuous ridging over eastern Alaska / western U.S. / western Canada. Meanwhile, on the Atlantic side, there is a good chance the NAO goes negative by the middle of the month. Let's take a look how it might come together. 


The storm system many of us were tracking around January 10th is likely to bring rain to the area. The 12z EURO OP model phases the northern and southern stream upper level energy around the Ohio Valley. A potent Low Pressure System tracks toward Cleveland keeping the east coast warm sectored. The ridge spike in the west and the amplifying SE Ridge ahead of the strong STJ energy helps phase these two Jets early. What's important is what models do with this storm once it tracks into eastern Canada. 


Above is the 12z EURO 500mb vorts valid Wednesday morning (01/12). Bottom left (GEPS) and bottom right (EPS) are shown in the same time frame as the above image. In the top image, you can see a strong piece of upper energy is rotating around the Polar Vortex into the east-central U.S. Another piece of southern energy evolving from the Sub-Tropical Jet Stream is located just S&E of the baroclinic zone. If the northern and southern Jet Streams phase, it could spark a coastal storm to develop on Wednesday. Due to the location of the Polar Vortex thanks to the high-latitude blocking, there will be sufficient cold air entrenched over the east coast to promote precipitation to fall in the form of snow. The bottom two images do a nice job showing how a -NAO (higher heights over Davis Strait / Greenland) can slow down the flow and push the PV to a lower latitude. What's especially impressive is how the EPO ridge closed off over the western Arctic. The -AO and -NAO ridges are very close to linking, or bridging, in these maps on both Ensemble plots. This is almost textbook of what a "blocking" pattern looks like in the upper levels of our atmosphere. The cold air is cut-off from escaping east and is left stationed over the eastern U.S. Also notice the anomalous trough over the Aleutians. I mentioned earlier how the location and magnitude of the tropical forcing favors an Aleutian trough which in turn pumps heights over western NA. 

I am not convinced a storm effects our area on Wednesday 01/12 yet. I do think one will form, but it's possible by the time it does the baroclinic zone will be located too far off the coast. Reason being, I think the blocking pattern will still be in the process of maturing which could keep the flow just progressive enough to prevent a storm from coming up the coast. If we can get more digging from northern stream energy, that will help pull the trough axis a bit further west and promote a storm along or just off the coast. We'll see where trends take us as we head into the weekend. 


I think the time frame that interests me more is between January 16th and 23rd. By then, the -NAO should be well established along with the -AO/-EPO couplet. The EPS, shown above, show a very impressive upper level pattern. Verbatim this type of pattern gets me very excited. If I'm looking for a Godzilla, this would be the time frame I pay special attention to. It will be interesting to see if models maintain the anomalous -AO/-NAO signal in the medium to long range. If they do, I think there will be exciting times ahead for tracking our first widespread snow event(s) of the season. There is still a long way to go. We'll see how this looks next week! 

Enjoy the rest of your week. 

Best,

Francesco Paparatto 

_________________________________________________________________________________

Join the forum: www.njstrongweatherforum.com 

Follow me on Twitter
Follow me on Facebook


Monday, January 4, 2016

01/04/16 Mo Mo: Watching Two Storm Systems

Note: The bottom of each blog from this point forward will have a "Layman's Terms" section for people who may not understand the technical discussion. 

Welcome to 2016. In last week's Mo Mo I discussed how the new year will bring a new pattern. The biggest difference between December's pattern and the one we're currently in is the western U.S. is no longer seeing the core of the cold. 

December 2015 was the warmest December ever for Central Park, NY and neighboring suburbs. 


The difference between December and January at 500mb that will bring the biggest influence to our sensible weather is the circled area of Alaska and the western Arctic. In December, this region saw negative height anomalies which extended all the way into the western U.S. (-PNA). 


This month is showing positive heights over this area which signals the EPO to be negative. The EURO projection of the EPO does indeed take it from positive in December to negative in January. What this does is help weaken the Tropospheric Polar Vortex and bring it into the lower latitudes of Canada. In turn, colder air is forced into the CONUS. 


The higher heights along western NA and from the Kara Sea into the Arctic promote a negative AO. The EURO projection above also shows an AO going from a positive mean state in December to a negative phase in January. I have already seen some people argue "what pattern change" as they see what their sensible weather will be like the first week of January, but I urge them not to focus strictly what the weather in their backyard will be like. It is important to see what is happening over the Continent. The Globe for that matter. These higher heights over the EPO and AO domains should definitely be characterized as a pattern change compared to December's H5 pattern. 

That said, is this the type of pattern change that will bring extreme cold and numerous snowstorms to the northeast? No it is not. I stated in last week's Mo Mo this is a pattern TRANSITION that will lead to a full-scale pattern change probably by week 4 of January. And even a full-scale pattern change, which should involve a Sudden Stratospheric Warming Event, will not bring the type of cold we have seen the previous two winters. Under a strong El Nino regime, it will be difficult to suppress the Sub-Tropical Jet Stream over an extended period of time. 

There are two storm systems that will effect the area this weekend and next week. The first one is for January 8th-9th and the second one - at this juncture - is for January 10th-11th. The second system has a higher probability of bringing our first accumulating snowfall event of the season. 


If we look at the EURO valid the morning of January 6th using 500mb vort, we can see all the players are on the field for both of the aforementioned systems. Storm #1 is located over Texas and Storm #2 is in southern California. Storm #1 will cut into Chicago as a weak surface low. This means rain will move into our area late Friday into early Saturday this weekend. With Storm #1 cutting, this will sweep a cold front through our area which will lower heights and bring colder air. Is the cold air that follows behind the cold front from Storm #1 cold enough to support wintry weather for Storm #2? This is a tricky question and one that may not be answered over the next couple days. 


Fast forward to Saturday morning, Storm #2 is already in the southeast ready to come into the northeast. Notice how close both storm systems are to each other. Storm #1 effects us Saturday morning which is the same time frame Storm #2 is in the southeast. If this is the case, Storm #1 is not going to have a lot of time to act as a potential 50/50 block to help keep cold air entrenched over the northeast. Also, northern stream energy could essentially get cut-off from phasing in with Storm #2 (southern stream energy). The more wave spacing between these two systems, the better. So far, operational models are NOT showing that. Storm #2 is likely to take two possible tracks: 

Blue track is up the east coast but it does not guarantee snow for coastal sections since we're not sure if there will be a phase with northern stream energy. It will be up to how quickly Storm #1 gets out of the way and whether or not northern stream energy can dig into the CONUS as a result of the Pacific Ridge amplifying. Right now, Pacific and Polar energy are phasing together to keep the PV too far west, thus keeping the cold we need for it to snow too far away. 

Purple track is what the 12z EURO OP from yesterday showed. There was no phasing with northern stream energy and the surface low cut to our west since the PV is in western Canada and there is no 50/50 block from Storm #1. 

There is also a chance Storm #2 goes out to sea. If the Pacific Ridge collapses the flow will turn progressive and all the energy is shunned east. 


Noteworthy is how different the Ensemble suites are from their OP counterparts. For example, the 18z GEFS and the 12z EPS Means look nothing like the Operational Runs in regards to Storm #2. The GEFS, shown above, depict a PV over the Hudson with northern stream energy digging into the eastern CONUS. The southern vort is not able to cut because of the NW flow so it has no choice but to take a track off the coast. Like I mentioned, just because the storm takes a track up the coast does NOT mean it will be cold enough to snow. Ideally we like to see a phase with northern energy occur around the Mid-Atlantic so the storm deepens and pulls in cold air. The GEFS were close but no cigar in that regard. 

The 12z EPS Mean were much closer with the phase. They showed an amplified western ridge which allowed northern stream energy to dig sooner toward the coast and ultimately phase with southern stream energy. Notice how neither Ensemble Suite cuts Storm #2. It is either a track off the coast or out to sea. 

My initial thought's are Storm #2 will end up being a coastal system or one that heads out to sea. I stress, a coastal system may not have enough cold air to promote snowfall. If models trend differently with how the handle the northern stream energy, specifically not trying to phase it with Pacific energy, then I think we can get a nicely timed phase which could result in a widespread snowstorm for the area. There is still a lot of time to see how this plays out. Once models put Storm #1 behind them, we should have a better idea of where and what Storm #2 will do. 

Layman's Terms

The first two days of this week will feature cold temperatures. High's in the 20's to low 30's and low's in the single digits N&W to teens around NYC. Expect rain to move in late Friday into early Saturday. Less than half an inch of rain is expected. Once the cold front comes through, colder temps will move into our area Sunday into early next week with another storm system possible Monday-Tuesday. This storm has the potential to bring accumulating snow to the area, but it largely depends what happens with Storm #1 and the behavior of northern stream energy. I am still expecting a full-scale pattern change to occur by the end of January which should bring sustained cold and better snow chances for our area. 

I may have another blog update in the middle of the week. 

Have a nice day. 

Best,

Francesco Paparatto 
____________________________________________________

Join the forum: www.njstrongweatherforum.com 

Follow me on Twitter
Follow me on Facebook