Another year, another winter outlook. This will be my 3rd one since starting NJ Strong Weather and every year I feel like I have more to say. The upcoming winter season may be the most challenging forecast yet compared to the previous two. We have a unique combination of extremely warm sea surface temperatures in the Tropical, Eastern, and Northern Pacific Ocean. There are not many examples in weather history that had this type of sea surface temperature configuration. We'll have to rely on current observations and how they drive our upper atmosphere to forecast this one. Here are the key factors the outlook will walk you through:
- Pacific and Atlantic SST (Sea Surface Temperature) Profiles
- ENSO (El Nino Southern Oscillation)
- Northern Hemisphere Snow Cover
- The Solar Cycle
- Behavior and Impact of the MJO (Madden-Julian Oscillation)
- Possible Analogs
- 2015-2016 Winter Forecast
- Wildcards
- Recap
Weather is not an exact science. Computer simulations of different weather models rely on a variety of algorithms to produce their results. Some are better than others, but still, how many times has your local weatherman predicted snow accumulation and you wake up in the morning to see full grass? Imagine trying to predict an entire season in advance! There are different forces in our atmosphere that work together to drive our weather pattern. It's my job to digest the information, study the variables, and figure out how they will intertwine. An unforeseen behavior in just one of those variables could completely change my winter forecast. After studying the aforementioned factors and collecting as much information as possible the last couple of months, I have high degree of confidence in this outlook.
Pacific and Atlantic Ocean SST (Sea Surface Temperature) Profiles
There is a lot to be said about oceanic sea surface temperatures. They have a strong influence on our sub-tropical and polar jet streams. Also, depending on where the warm or cold anomalies set up, they play a critical role in determining where our mean troughs and ridges set up at the 500mb level of our atmosphere.


Here is how the Pacific SST anomaly map looks. The orange and red colors represent warmer than normal while the blue colors indicate colder than normal SST's. There are 2 main areas we should focus on:
1. 60N - 140W and the area of ocean south and east of there. This approximately represents the PDO, Pacific Decadal Oscillation, region. Like most oscillations, the PDO comes in a warm or cold phase and is usually measured monthly. Positive values indicates there are warmer than normal SST's over this region, while negative values point toward cooler than normal SST's. Simple, right? By looking at this map in the coordinated region, we can easily see the PDO is in a strongly positive phase. The September PDO value came in at +1.97, which is 3rd warmest on record for September since 1950 behind 1997 and 1987 (no surprise either both were El Nino years). Taking what I said about SST's into consideration, the +PDO signal means we should see our -EPO/+PNA couplet return this winter like we saw last year.
The EPO is the East-Pacific Oscillation and, when in a negative state, indicates positive heights over Alaska / Western Canada and possibly into the Arctic Circle depending on its amplitude. PNA stands for Pacific North American, another oscillation. When this signal is positive it represents higher than normal heights over the western U.S. I mentioned all three of these signals were in the same state last winter.

Above is our 500mb geopotential heights from last winter. I marked where the EPO and PNA regions preside. If you look at this image and compare it to the current Pacific SST anomaly map I posted, you'll see why I am banking on another -EPO/+PNA year. The warm waters should lead to a positive feedback loop back into our atmosphere. Naturally, Earth tries to balance the cold and warm temperature anomalies by feeding off the rising or sinking air pressures. Given the look of SSTA's in the Pac, expect ridging or above normal temperatures to be the norm in the western US, western Canada, and Alaska.
2. The second area I wanted to draw attention to in the Pacific SST anomaly map is between 30N and 40N out to 160W. This region is currently experiencing below normal SST's. If you look at last winter's Pac. SST anomaly map, this same area also saw negative 500mb heights (where I say "keep this in mind). Negative heights in this area usually leads to trough formation over the Aleutian Islands. The stronger or more anomalously negative the "Aleutian trough" is, the more amplified the ridging will be over the EPO and PNA regions.
Now that there is an understanding of how I expect the North / Eastern Pacific Oscillations to behave this winter based on the look of the SST's, let's discuss the North Atlantic Oscillation.
For the eastern U.S., the NAO is one of the most critical winter teleconnections because it has the ability to deliver a very active and anomalous weather pattern. When the NAO is negative, positive heights are present over the high latitudes of Greenland / Davis Strait / Northern Atlantic Ocean regions which in retrospect lead to negative heights over the eastern U.S. A positive phase features the opposite though it does not mean the eastern U.S. will see above normal heights. For instance, the last two winters the NAO was mainly positive but the -EPO/-AO/+PNA trio helped maintain the cold over our area. A +NAO is indicative of a "progressive" pattern while a -NAO points to a "blocking" pattern. The "blocking" pattern disturbs the Global Wind Cycle and forces the northern jet stream to slow down considerably. Instead of low pressure systems exiting the east coast in a 6-12 hour period, they usually slow down, deepen, and prolong the weather event.

Atlantic SST anomalies show 2 warm pools - Davis Strait and western Atlantic - and a cold pool in the north central Atlantic. This "tripole" configuration is historically known to deliver a -NAO. I do not have scientific knowledge to explain the reasoning behind this - besides Earth's natural process of balancing rising air with sinking air - so let's take a look at some examples.
The last two winters to feature a moderate to strong -NAO were 2009-2010 and 2010-2011. Both those winter seasons produced large coastal storms, or Godzilla's in my handbook. Here is a look of the Atlantic SSTA's at the time.
2009-2010:

2010-2011:

All three images feature above normal SST's over the Davis Strait and a cool pool in the northern Atlantic.
What else can we look at to predict the future of the NAO? I am always intrigued and fascinated by the research Al Marinaro does on a day to day basis. Please click here to check out his Twitter page. He looks at October Sea Level Pressure in the North Pacific and finds a correlation between the October SLP value and -NAO winters.

He points out that the Oct 1st-17th average North Pac SLP came in at <1013mb. If you look at his list of analogs, winters matching that observation had a -NAO. He warns this could chance since the research was done in mid-October. I went ahead and got the latest North Pac. SLP map.

I do not know how Al calculated the SLP, but if I compare the latest graphic with the one he put out in mid-October I would guess the SLP is still below the 1013mb threshold.
Taking the Atlantic SSTA and Al's research into consideration, I have a fair level of confidence this winter's NAO will be predominately negative.
El Nino Southern Oscillation (ENSO)
Let's jump back to the Pacific to talk about the "Godzilla" El Nino everyone seems to be talking about. ENSO measures variations in sea surface temperatures over the Tropical Pacific. A positive phase of the ENSO signifies El Nino while a negative phase means La Nina. El Nino's typically bring active weather to the U.S. thanks to the Sub-Tropical Jet Stream. A "train" of moisture typically travels the southern tier of the country bringing monsoon-like conditions to southern California and the Southwest. These storms make there way into the southeast and eventually up the coast into the northeast. What most weather enthusiast love about El Nino winters is the higher probability of seeing bigger storms. If there is interaction between the northern and southern branches' it brings "explosive" conditions to the upper level atmosphere. This translates to cyclogenesis, or "bombogenesis" at the surface with low pressure systems off the coast. In other words, Nor'easters.


The Nino regions are divided in 4 parts: 4, 3.4, 3, and 1+2. The first image gives you an idea, from a long / lat standpoint, where each region is located. The second image is a Tropical Pacific (Equatorial Pacific) SST anomaly map. When Nino region 3.4 experiences temp anomalies of at least +0.5*C over five consecutive 3-month running mean periods, the ENSO is officially classified as El Nino. Meteorologists typically refer to this as the ONI, or Oceanic Nino Index.
We reached this threshold in the last trimonthly period with an ONI value of +1.5*C. When the ONI reaches +2.0*C, it's indicative of a strong El Nino forming.

Current observations show a very strong El Nino. As of the week of Oct-21, Nino region 3.4 registered +2.5*C ONI. Notice how much this region has strengthened since August. This is good news for winter weather lovers, because if Nino region 1+2 remained dominant, an east-based strong El Nino like we saw in 1997 would have brought an above average temperature regime to the eastern CONUS. However, strong El Nino's in general could still bring warm conditions to much of the country because the STJ, or sub-tropical jet stream, could overpower the pattern and flood the country with warm Pacific air. The ideal scenario would be to have the warmest anomalies be over Nino region 3.4 but at moderate levels (between +1.3 and +1.9) and basin-wide (spread through all Nino regions). We have the latter working for us, but not the former AT THIS TIME. I stress "at this time" because we're beginning to see major changes take place with regards to our El Nino.
Looking back at the Tropical Pacific SSTA map, you'll see the warmest anomalies are between 140W and 100W, or Nino regions 3.4 and 3. Earlier in the summer and fall, the warmest anomalies were confined to Nino region 1+2 (see ONI values from graphic). This observation of the warmest anomalies spreading west indicates El Nino is looking to be "basin-wide" rather than "east-based."

The change in SSTA's over the last 30 days proves Nino region 1+2 is cooling. The deep blue and purple colors on the image to the right shows the tremendous reversal in SSTA's. Meanwhile, the image on the left shows more orange and red colors which means Nino region 3.4 has been warming over this time. One of the reasons for this change of events is seen at the 850mb level.

This graphic represents 850mb zonal wind anomalies and their longitude location over the entire world. Earlier in October, we were seeing above normal zonal winds at 120E. Since then, these zonal winds propagated east to the Dateline, or the 180 longitude line which passes through the mid-Pacific Ocean. What are we tracking that is also found at this location? Oh yea, our El Nino. For much of October, the presence of these above normal zonal 850mb winds over the Dateline signify anomalous westerly winds. These above normal westerly wind bursts likely originated from the Indian Ocean or western Pacific from deep low pressure systems (likely Typhoons). Winds from low pressure systems north and and winds from low pressure systems south of the Equator combine together to produce strong eastward winds over the Tropical Pacific. These eastward winds help track Kelvin Waves from west to east and aid in strengthening El Nino. The above normal 850mb zonal winds between 180 and 120W indicate Nino regions 4 and 3.4 have been warming steadily the last 30 days and this looks to continue into November.

This image shows OLR, or Outgoing Longwave Radiation, anomalies over the Pacific. Negative OLR anomalies, which is the like a blue color on the above scale, indicates stormy weather. The CFS is forecasting negative OLR anomalies to persist through much of November between 180 and 120W, which means El Nino is not in any hurry to weaken over regions 3.4 to 3.

The SOI, or Southern Oscillation Index, is another tool Meteorologist's use to determine the intensity of El Nino. Values between +8 and -8 sd mean there is a "La Nada", or no ENSO present. Values above +8 mean we're seeing La Nina conditions while values below -8 point to El Nino. The more negative the SOI is the stronger the El Nino event. From the latest 30-day moving SOI graph above we can see the SOI registered a value of -19.8. Actually, the SOI is even more negative than that as you'll see in the next chart. This tells me the same thing the other observations we looked at were saying - the current El Nino event is very strong.
Are there signs of this event weakening? Remember, winter weather lovers found in the northeast preferably want moderate El Nino conditions not strong one's. This means not one factor can overwhelm an entire pattern. The Polar Jet Stream will not have a big influence on the pattern if El Nino is too strong.

We can start by checking out the SOI trend. As of 24-Oct, the SOI was impressively -21.34 sd. However, it has been on decline since 15-Oct. It's not a fast decline but it's a trend nonetheless. We want to see this value get between -10 and -16 sd over the course of the winter season. **I just checked the latest value as of Oct-31 and it's now up to -21.01, so the trend continues.** This means El Nino could be weakening but we still have a long way to go.
In addition to current observations, let's take a look at some of the statistical and dynamical models.
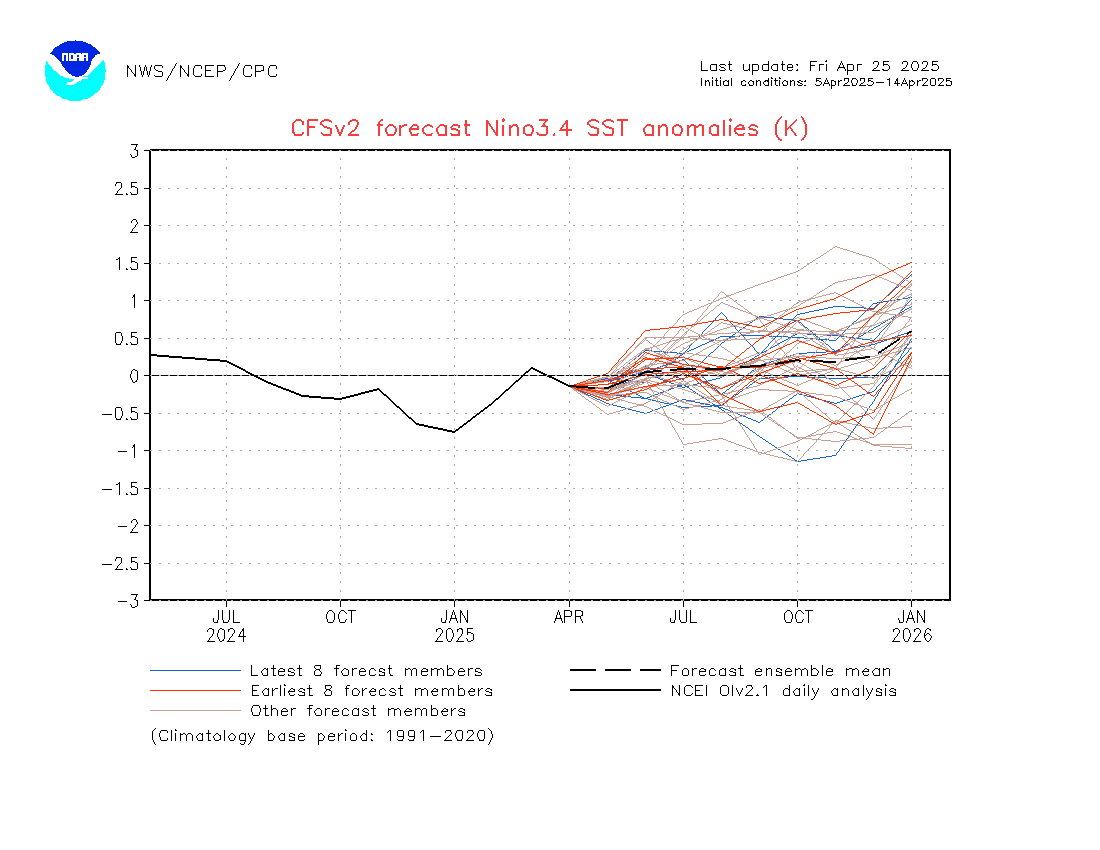
The CFS believes El Nino will peak sometime in November but it's still at or above +2.0*C to start January.

Some people felt the 3-4 day decline in Nino region 3.4 in mid-October indicated El Nino reached its peak. Obviously that is not the case given what I outlined about OLR and 850mb zonal winds. We saw temps climb slightly these last few days of October.

It looks like the dynamical and statistical models from IRI/CPC agree with the CFS that El Nino will turn moderate by January or so.
At this time, I feel El Nino will begin to weaken in mid-November but it will not get under +2.0*C until Christmas week. That is not to say December will not feature possible snow threats. We'll have to see how much cold air can make it to the coast.
Northern Hemisphere Snow Cover
Judah Cohen, a researcher at MIT, found there is a strong correlation between the SCE / SAI (snow cover extent or snow advance index) and the AO (Arctic Oscillation). The study is simple: the more extensive the snow coverage and depth over Siberia or Eurasia, the higher the probability of the ensuing winter AO being negative. A negative AO displaces the Polar Vortex (America's new favorite word) from the North Pole to the lower latitudes of Canada or even the U.S. This brings extremely cold temperatures to the area. We have seen this a couple of times the last couple of winters thanks to the anomalously negative EPO.

This is an old graphic, but it does a nice job showing how closely matched the SAI and AO are.
Compared to the 1998-2011 average, this year is running well above normal in regards to northern hemisphere snow depth. In my opinion, depth could be better than coverage because a brief period of warm temperatures will not have a detrimental impact to the SAI. Also, this should allow areas of High Pressure to develop over Siberia which would help displace the cold into North America.

This years snow coverage is yet to reach last years levels, but we're making great progress. Where we're slacking is from central Canada to Alaska.

The GFS forecasts snow depth to expand south and east over the next 10 days. Also, depth will continue to deepen over areas already covered in snow. Obviously this should be the case as we get deeper into the season, but it's important to see this happening because it could go a long way in establishing a cold air source for our area.
In sum, I expect a high probability of the AO sustaining a negative phase this winter.
The Solar Cycle
A plunge in solar activity has some talking about the possibility of a mini "ice age." So far, there is not enough evidence to suggest this will happen. Still, the weak activity does have an effect on our weather this winter. We're currently in Solar Cycle 24 and it's on pace to have the lowest recorded sunspot activity on record. These cycles occur every 11 years. Back in 2009-2010, when there was virtually no sun activity, we saw extensive blocking (-NAO). This is not a coincidence. Historical trends show when there is little to no sun activity, the NAO has a high likelihood of going negative. It's not quite to the extreme of 2009-2010, 1995-1996, or 1985-1986 (years when the solar cycle was at a minimum), but it still leads to a build up of warmth in the Stratosphere which could eventually lead to a Sudden Stratospheric Warming Event (SSWE).

This image does a nice job illustrating how inactive, on average, Solar Cycle 24 has been. After the minimum seen in 2009-2010, the sun has not really rebounded like it has in previous Solar Cycles. In fact, forecasts have the solar flux declining.

The purple line tracks solar progression on a monthly basis. While there was a spike in sunspots earlier this fall, the number plunged again at the last update.
Overall, I do not expect the sun to have as big of an impact this winter like the other factors. This cycle is still a few years away from approaching a solar minimum.
Impact of the MJO
The Madden Julian Oscillation is characterized by enhanced or suppressed tropical rainfall over the Indian Ocean and Tropical Pacific. The MJO is divided into 8 phases. As convection propagates east it enters different phases of the MJO. Each phase has a different affect to our 500mb pattern. The MJO does not drive our pattern but it sure does enhance it.

Here is an idea of where each phase of the MJO is located. In most moderate to strong El Nino years, the MJO is mainly inactive. Here is a look of what the MJO looked like in 2010 and 1998.

When the MJO is located inside the circle, it means it's inactive and does not have any impact to our current global weather pattern. You'll notice during these strong El Nino seasons, the MJO was either inside the circle or in weak phases. The best tools to observe the MJO are OLR anomalies, 850mb, or 200mb zonal wind anomalies. The upper winds give clues to where low pressure systems, or tropical convection, could be forming.
MJO phases that usually lead to colder than normal weather over the eastern U.S. are 7-8-1. For example, here is what the 500mb geopotential height anomaly graphic looks like when the MJO is in phase 8 during the month of February.

This demonstrates a -NAO / -AO / +PNA upper level pattern. A deep trough is located over the eastern CONUS. I am not saying this will happen this winter, but it gives you an idea of the impact the MJO could have on our pattern. And yes, there are certain phases that could lead to warmer than normal conditions for our area too.
Analogs
This will be my first winter forecast not using analogs. Like I mentioned at the start, this is a unique season with a combination of favorable Pacific and Atlantic SST's and a strong El Nino. There are pieces of atmospheric setups I can take from other years, but I rather put as much weight as possible in the other factors I talked about.
2015-2016 Winter Forecast

1. Pacific NW: This area is going to see plentiful days of seasonable temperatures and dry conditions. The northern jet stream will stay mainly north of here which means they will miss out on storm chances. The best chance for activity will be the 1st half of winter, before the Pacific Ridge sets in later in the season.
2. 4 Corners: With an onslaught of Pacific energy expected to pass through this area, periods of valley rain and mountain snow will be seen frequently. The ski companies are in for a nice treat this winter.
3. Southern Tier U.S: The southern tier of the country is expected to be in a wet pattern. The Sub-Tropical Jet stream will be active due to the strong-moderate El Nino. As a result, below normal temps can be expected.
4. Texas / LA: These two particular states in the southeast will see the most rain. They have been targeted the last 30 days this month which could be a clue to where the STJ is going to leave an everlasting presence. Row row row your boat...
5. Central Mid-Atlantic: This zone is kind of the divide to where I expect the warmer and colder than normal air masses to setup. While this winter will not be as cold as the last two, there will still be Arctic air that gets as far south as the Mid-Atlantic thanks to the -AO. However, the Nino is strong and will send mild tropical air all the way to the east coast.
6. Midwest / Great Lakes: This region is one of the most challenging forecasts. The 1st half of winter is likely to be on the milder and drier side relation to normal due to the raging El Nino. However, as the Nino weakens the Polar Jet will be able to penetrate further south into the CONUS. Your 2nd half of winter will feature much colder than normal temps compared to your 1st half, with snow chances around the Ohio Valley.
7. I-95 Corridor: Our last couple of winters have been brutally cold with numerous light to moderate snow events. We're in for a completely different look this year. There will not be as many brutal cold days or northern stream driven storm events. Instead, we're likely to start our winter off above normal with sizable storms ejecting out of the Sub-Tropical Jet Stream. The lack of blocking and poor cold air source early on means most of these storms should be in the form of rain, but obviously that's impossible to say for sure. However, by Christmas into early January I am expecting a pattern change that will lead to more cold and possibly bigger storms. The best month to get a Godzilla, a storm consisting of at least 12 inches of snow, will be in February which is when I think a -NAO could develop. If the -NAO does develop, it could result in several big storm systems the 2nd half of winter. When all is said and done, temperatures should finish around average or slightly below.
8. Northern New England: This area is use to seeing bitter cold and snowstorms. Historically, El Nino winters keep this type of cold air out of this region. The trough undercuts the ridge and all the cold anomalies are found in the southeast and mid-Atlantic. That said, I feel your first half of winter could be stormy but your second half should be colder due to the emergence of the -AO/-EPO.


December - As Iv'e stated numerous times in the write-up, El Nino is currently in a strong state and this opens the gate for mild air to flood the country, especially with positive AO/NAO oscillations expected. Temperatures for the NYC Metro area should run above normal, same with precipitation amounts. If we do see accumulating snow this month it will not be until Christmas time. It will be the New Years period when I expect the pattern change to begin. By pattern change, I mean a mid level atmosphere that looks more like typical moderate El Nino's than strong one's, and the beginnings of a sustained -AO.
January - Pattern changes / transitions usually take time. The first couple of weeks may be pretty transient with warm shots mixed with cold one's too. We'll continue to see storm threats with a higher likelihood for snow than December. By mid-month, I am expecting the AO and EPO to be negative. However, I'm not confident the NAO will be negative by this time. I think January will feature a lot of "thread the needle" type of storm events.
February - This is going to be the best month of the Meteorological winter. It will feature our coldest temp departures of the season, as well as, our biggest storm systems. I can definitely see how a Godzilla impacts our area this month. El Nino should be in a moderate stage by then, the AO/EPO should be negative, and I even think the NAO could be west-based negative at this time as well. This type of pattern may even last into March.
Snowfall Forecast for I-95 Corridor
Tracking snow along the I-95 corridor may come late this year. The Polar Jet Stream is not going to overrun the Sub-Tropical Jet Stream until El Nino weakens to moderate stages. This means mild air is going to win out over cold air for the first month of winter. Like I mentioned, by Christmas we should begin to see changes with more cold air being pulled south and east to the east coast. Here is a prediction for select cities of total snowfall this season. These numbers take into consideration all the factors I detailed above. I usually do not like to do these type of predictions because the point of a seasonal outlook is not to be this granular. So I warn to take these numbers with a grain of salt. For example, all it takes is 1 big storm to hit Philly for this prediction to be way off.
NYC: 30-40"
Washington D.C: 15-25"
Philly: 20-30"
Boston: 45-55"
Newark, NJ: 30-40"
Hackettstown, NJ: 45-55"
Atlantic City, NJ: 25-35"
Allentown, PA: 35-45"
Wildcards
1. The MJO: While the MJO historically stays inactive during +ENSO events, a pulse into phases 1 or 2 could have dramatic effects on our weather pattern. The MJO acts as an enhancer to our pattern so the STJ would only get stronger if this does amplify. That means precip departures from normal would be higher across the southern U.S. and up the east coast.
2. The Stratosphere: You probably noticed I did not spend time discussing the Stratosphere, specifically the QBO. I feel this feature is highly unpredictable and its impacts to our weather pattern are quite unknown or have little effect. Sudden Stratospheric Warming Events are typical every winter, and could lead to the formation of a -NAO, but where they occur is always tricky to forecast. If the AO is still positive come January...we have big problems and would likely need the help of our Stratosphere to help displace the PV out of the Arctic.
3. El Nino Does Not Weaken: I have high confidence El Nino will weaken, but it's worth mentioning if it does not we'll see a very warm winter across the eastern U.S. We've already seen the warm SST anomalies push west to create a more basin-wide event, but that will not mean much if Nino continues averaging >2.0*C in region 3.4. The CFS suggests El Nino will weaken to moderate stage by January 1st. If it does, the rest of the forecast should play out accordingly.
4. The NAO: I talked briefly about the NAO and showed you Al Marinaro's SLP correlation. If the Atlantic SSTA's undergo a change during the winter that would be against -NAO formation, we run the risk of seeing no blocking and the continuation of a progressive pattern. Hey, the progressive pattern thing has worked out for us these last few winters but who knows how it'll work out during an El Nino? This is probably the biggest wildcard.
5. March: The month of March has the ability to deliver colder than normal temperatures over the eastern U.S. At this moment, I feel March could be an extension of February with colder than normal departures and large coastal storms. Areas that are behind on their seasonal snowfall could make it up in March this year.
Recap
I hope you enjoyed reading this year's winter outlook. Obviously there is a lot of information to digest and process. Here is a bullet point summary of what I discussed:
- El Nino is strong but signs point to it weakening to a moderate stage around Christmas
- Pacific and Atlantic sea surface temperature anomalies promote the emergence of a -AO/-NAO/-EPO sometime this winter. However, my confidence level with the NAO is low compared to the other oscillations
- Northern Hemisphere snow cover has picked up tremendously the last 10 days. Models show this continuing into the 1st half of November. Establishing this snow cover base may help in getting a -AO this winter.
- Our 1st half of winter will feature above normal temperatures and frequent rain chances. As the pattern transitions, we'll enter a colder than normal with increased snow threats by Christmas. We won't get into the heart of the winter season until February this year.
If you have any questions, please direct them to njstrongwx@gmail.com or post directly on the forum. If you're not a member of the forum, please consider registering (free!) so you're up to date on the latest short and long term weather updates.
Follow me on Social Media:
Twitter: https://twitter.com/nj_strong_wx
Thanks for reading!!
Francesco Paparatto


